S&P 500 Large Cap Index ( SPX ) Is the Top Close at Hand ?
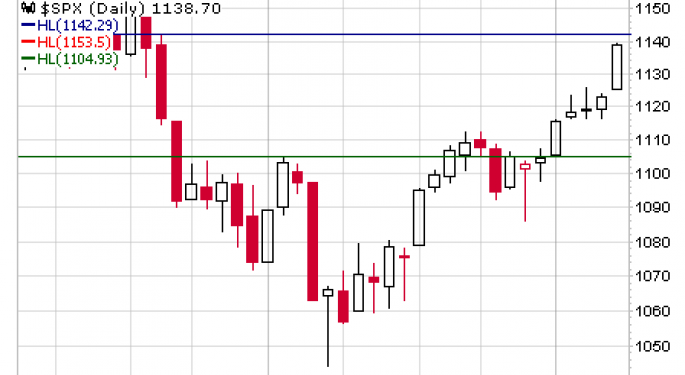
The S&P 500 Large Cap Index ( NYSE:$SPX ) had a spectacular rise in the last session. The Index gained 15.73 points to close at 1138.70 . The intraday high of 1139.38 [ a rise of 53.36 points from the start [ 1086.02 ] of this latest up leg was equal to a Fibonacci ratio 0.786 of the rise from 1044.5 to 1112.42. It may have been the final lower high of the rise that started at 1044.5 on February 5, 2010.
This latest rise of the Bear Market rally has been contained within an Ascending Channel [ AC ] with the Upper Boundary [ UB ] at 1142± and the Lower Boundary [ LB ] at 1106± . Within the AC there is a more recent AC that has a Lower Boundary of 1125± which relates to a Fibonacci level at 1125.45 as well as the Gap Up that was formed in the last session.
Those are the three levels to watch in the coming session. The Upper Boundary is essentially the same level as a projected target [ T ] level of 1142.29 . A break above this level could lead to a test at 1153.94 - 1154.39 . The Lower Boundary at 1106, if broken to downside, will probably be a signal that a significant correction is finally underway.
The Compiled Resistance and Support data is shown below.
S&P 500 Large Cap Index ( NYSE:$SPX )
Resistance and Support Levels
- TI- 1195.91
- F- 1179.27
- R4- 1177.18
- TI- 1172.41
- R3- 1162.92
- T- 1154.39
- T- 1153.94
- R2- 1148.66
- R1- 1143.68
- TI- 1142.29
- ACUB- 1142±
- TI- 1139.38
- DC- 1138.70
- F- 1138.37
- S1- 1129.42
- F- 1125.45
- S2- 1120.14
- ACLB- 1106±
- S3- 1105.88
- S4- 1091.62
© 2025 Benzinga.com. Benzinga does not provide investment advice. All rights reserved.
Posted-In: S&P 500 Large Cap IndexTechnicals Intraday Update Markets


