Home Depot's Bullish Streak Confronts Q3 Earnings Expectations

The Home Depot Inc (NYSE:HD) will be reporting its third-quarter earnings on Tuesday. Wall Street expects $3.64 in EPS and $39.17 in revenues as the company reports before market hours.
The stock is up 42.56% over the past year, 19% YTD.
Let’s look at what the charts indicate for Home Depot stock and how the stock currently maps against Wall Street estimates.
Read Also: How To Earn $500 A Month From Home Depot Stock Ahead Of Q3 Earnings
Home Depot Stock In Bullish Trend Ahead Of Q3 Earnings
Home Depot's stock is holding firm in a bullish trend, trading above key moving averages, signaling ongoing buying interest.
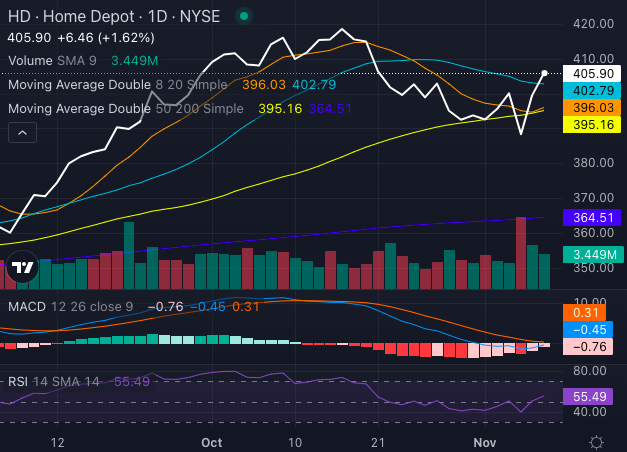
Chart created using Benzinga Pro
At $405.90, Home Depot's stock stands well above its eight-day SMA (simple moving average) of $396.03 and its 20-day SMA of $402.79, reinforcing short-term strength.
Additionally, the stock remains elevated beyond its 50-day SMA of $395.16 and far above its 200-day SMA of $364.51, suggesting broader momentum.
However, with an MACD (moving average convergence/divergence) reading of a negative 0.45, there could be a hint of hesitation. The RSI at 55.49 shows steady interest, albeit within neutral bounds, indicating that the stock is currently balanced between momentum and consolidation.
Home Depot Analysts See Almost 3% Upside
Ratings & Consensus Estimates: The consensus analyst rating on Home Depot stock stands at a Buy currently with a price target of $419.29. The latest analyst ratings from RBC Capital, Stifel and Telsey Advisory Group set an average price target of $422.67 for Home Depot stock, implying a 2.93% upside potential.
HD Price Action: Home Depot stock was trading at $409.89 at the time of publication Monday.
Read Next:
Photo: Sockagphoto via Shutterstock
© 2025 Benzinga.com. Benzinga does not provide investment advice. All rights reserved.
Posted-In: Expert Ideas hardware stores Pro Project SHLTechnicals Previews Top Stories Trading Ideas