The Dow Jones Just Saw A Coveted Golden Cross — But There's A Plot Twist This Time

The Dow Jones Industrial Average just gave a classic bullish signal — but traders might want to hold the champagne.
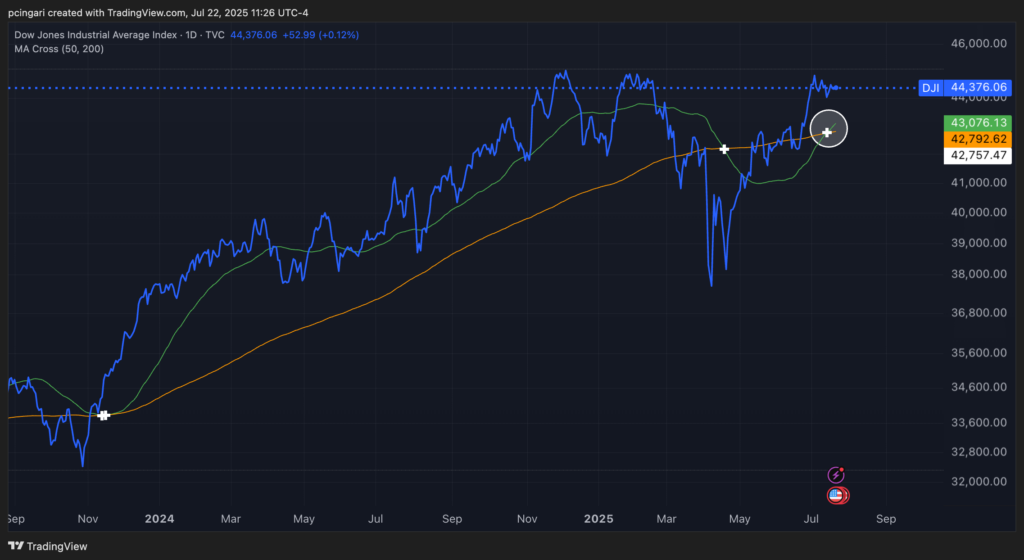
On July 16, the Dow's 50-day moving average crossed above its 200-day moving average, forming a golden cross — a pattern widely seen by technical analysts as a sign of bullish momentum.
It marked the first such crossover for the Dow in nearly two years, following a choppy spring sell-off triggered by tariff volatility and economic uncertainty.
For many traders, this pattern signals that dip-buyers have been joined by longer-term bulls, reinforcing the strength of the uptrend.
But before loading up on blue-chip stocks or the SPDR Dow Jones Industrial Average ETF (NYSE:DIA), it’s worth considering two inconvenient truths: history and seasonality don't back the hype.
Chart: Dow Flashes Golden Cross In July 2025 — But History Says Caution
Over the past 30 years, the Dow has flashed a golden cross 24 times. But contrary to popular belief, the track record is mediocre at best.
A backtested strategy of buying the Dow right when the golden cross occurs and selling at the next death cross (when the 50-day falls below the 200-day) yields an average return of just 4.36%, with a win rate of only 54% — barely better than a coin toss.
That means out of the 24 signals, only 13 were profitable, and 11 lost money. The average holding period? 201 days.
Traders who got in during January 2012 and held through August 2015 enjoyed a 40.27% gain — the strongest of the streak — while those who bought the March 2019 signal and held into the March 2020 crash lost 23.76%.
A golden cross on the Dow is no magic formula — unlike the same signal on the tech-heavy Nasdaq 100, where it historically delivered stronger gains.
Here's how a golden cross strategy on the Dow Jones Industrial Average would have performed over the past 30 years:
Total trades
24
Winning trades
13
Losing trades
11
Win Rate
54.17%
Average Return
4.36%
Average Trade Length
201 days
Best trade
40.27% (Jan. 2012-Aug. 2015)
Worst trade
-23.76% (March 2019-March 2020)
Bad Timing: Seasonality Turns Bearish Now
If historical returns weren't concerning enough, seasonality is now stacked against the bulls.
August and September are statistically the worst two months of the year for the Dow. Over the past 30 years, August has averaged a -0.78% return, while September clocks in at -0.73%.
The probability of a gain? Just 53% in August and 50% in September.
While the Dow defied the odds last year — gaining 1.76% in August and 1.85% in September — those were outliers.
In fact, the index posted negative returns in August 2022 and 2023, and September has been red for four of the last five years.
The worst August on record was in 1998, when the Dow plunged 15.13%, and the worst September came in 2002, with a 12.37% drop.
Year
August Return
September Return
1995
-2.08%
3.87%
1996
1.58%
4.74%
1997
-7.30%
4.24%
1998
-15.13%
4.03%
1999
1.63%
-4.55%
2000
6.59%
-5.03%
2001
-5.45%
-11.08%
2002
-0.84%
-12.37%
2003
1.97%
-1.49%
2004
0.34%
-0.92%
2005
-1.50%
0.83%
2006
1.75%
2.62%
2007
1.10%
4.03%
2008
1.45%
-6.00%
2009
3.54%
2.27%
2010
-4.31%
7.72%
2011
-4.36%
-6.03%
2012
0.63%
2.65%
2013
-4.45%
2.16%
2014
3.23%
-0.32%
2015
-6.57%
-1.47%
2016
-0.17%
-0.50%
2017
0.26%
2.08%
2018
2.16%
1.90%
2019
-1.72%
1.95%
2020
7.57%
-2.28%
2021
1.22%
-4.29%
2022
-4.06%
-8.84%
2023
-2.36%
-3.50%
2024
1.76%
1.85%
Average return
-0.78%
-0.73%
Win rate
53%
50%
Bottom Line
The Dow Jones just rang the golden cross bell — but with a weak historical win rate and the market entering its most treacherous season, investors may want to tread carefully.
For now, the technicals may say buy, but the calendar — and the stats — say, not so fast.
Read Now:
Photo: Shutterstock
© 2025 Benzinga.com. Benzinga does not provide investment advice. All rights reserved.
Posted-In: DOW Golden Cross Stories That MatterEquities Broad U.S. Equity ETFs Technicals Top Stories ETFs