American Express's Earnings Outlook

American Express (NYSE:AXP) is preparing to release its quarterly earnings on Friday, 2025-07-18. Here's a brief overview of what investors should keep in mind before the announcement.
Analysts expect American Express to report an earnings per share (EPS) of $3.86.
Investors in American Express are eagerly awaiting the company's announcement, hoping for news of surpassing estimates and positive guidance for the next quarter.
It's worth noting for new investors that stock prices can be heavily influenced by future projections rather than just past performance.
Past Earnings Performance
In the previous earnings release, the company beat EPS by $0.17, leading to a 0.0% drop in the share price the following trading session.
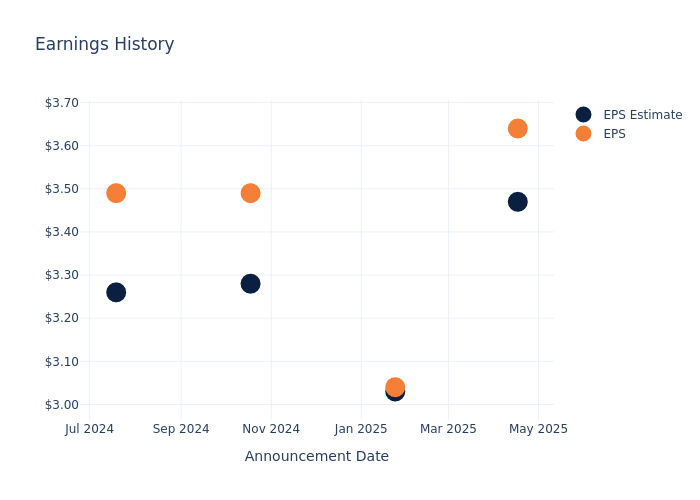
Here's a look at American Express's past performance and the resulting price change:
| Quarter | Q1 2025 | Q4 2024 | Q3 2024 | Q2 2024 |
|---|---|---|---|---|
| EPS Estimate | 3.47 | 3.03 | 3.28 | 3.26 |
| EPS Actual | 3.64 | 3.04 | 3.49 | 3.49 |
| Price Change % | -1.0% | -1.0% | -3.0% | -3.0% |
Market Performance of American Express's Stock
Shares of American Express were trading at $311.9 as of July 16. Over the last 52-week period, shares are up 29.57%. Given that these returns are generally positive, long-term shareholders are likely bullish going into this earnings release.
Analysts' Take on American Express
For investors, staying informed about market sentiments and expectations in the industry is paramount. This analysis provides an exploration of the latest insights on American Express.
The consensus rating for American Express is Neutral, derived from 14 analyst ratings. An average one-year price target of $304.71 implies a potential 2.31% downside.
Understanding Analyst Ratings Among Peers
In this comparison, we explore the analyst ratings and average 1-year price targets of Enova International and Dave, three prominent industry players, offering insights into their relative performance expectations and market positioning.
- Analysts currently favor an Buy trajectory for Enova International, with an average 1-year price target of $129.5, suggesting a potential 58.48% downside.
- Analysts currently favor an Buy trajectory for Dave, with an average 1-year price target of $234.73, suggesting a potential 24.74% downside.
Analysis Summary for Peers
In the peer analysis summary, key metrics for Enova International and Dave are highlighted, providing an understanding of their respective standings within the industry and offering insights into their market positions and comparative performance.
| Company | Consensus | Revenue Growth | Gross Profit | Return on Equity |
|---|---|---|---|---|
| Kaspi.kz | Outperform | 48.67% | $430.02B | 15.62% |
| Enova International | Buy | 22.24% | $345.64M | 6.10% |
| Dave | Buy | 46.65% | $100.87M | 15.06% |
Key Takeaway:
American Express ranks at the top for Gross Profit and Return on Equity among its peers. It is in the middle for Revenue Growth.
Get to Know American Express Better
American Express is a global financial institution, operating in about 130 countries, that provides consumers and businesses charge and credit card payment products. The company also operates a highly profitable merchant payment network. The firm operates in four segments: US consumer services, US commercial services, international card services, and global merchant and network services. In addition to payment products, the company's commercial business offers expense management tools, consulting services, and business loans.
American Express's Financial Performance
Market Capitalization: Surpassing industry standards, the company's market capitalization asserts its dominance in terms of size, suggesting a robust market position.
Positive Revenue Trend: Examining American Express's financials over 3 months reveals a positive narrative. The company achieved a noteworthy revenue growth rate of 7.38% as of 31 March, 2025, showcasing a substantial increase in top-line earnings. As compared to its peers, the revenue growth lags behind its industry peers. The company achieved a growth rate lower than the average among peers in Financials sector.
Net Margin: American Express's net margin excels beyond industry benchmarks, reaching 15.04%. This signifies efficient cost management and strong financial health.
Return on Equity (ROE): The company's ROE is a standout performer, exceeding industry averages. With an impressive ROE of 8.3%, the company showcases effective utilization of equity capital.
Return on Assets (ROA): American Express's ROA falls below industry averages, indicating challenges in efficiently utilizing assets. With an ROA of 0.92%, the company may face hurdles in generating optimal returns from its assets.
Debt Management: American Express's debt-to-equity ratio is below the industry average. With a ratio of 1.69, the company relies less on debt financing, maintaining a healthier balance between debt and equity, which can be viewed positively by investors.
To track all earnings releases for American Express visit their earnings calendar on our site.
This article was generated by Benzinga's automated content engine and reviewed by an editor.