Examining the Future: SLB's Earnings Outlook

SLB (NYSE:SLB) is set to give its latest quarterly earnings report on Friday, 2025-07-18. Here's what investors need to know before the announcement.
Analysts estimate that SLB will report an earnings per share (EPS) of $0.74.
The announcement from SLB is eagerly anticipated, with investors seeking news of surpassing estimates and favorable guidance for the next quarter.
It's worth noting for new investors that guidance can be a key determinant of stock price movements.
Earnings Track Record
The company's EPS missed by $0.02 in the last quarter, leading to a 0.0% drop in the share price on the following day.
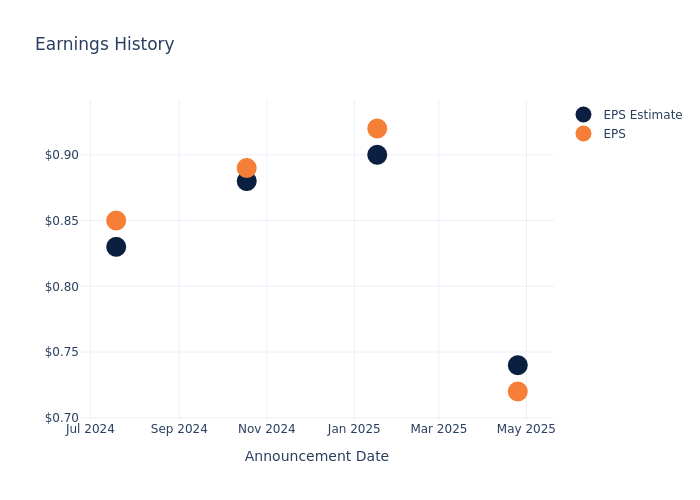
Here's a look at SLB's past performance and the resulting price change:
| Quarter | Q1 2025 | Q4 2024 | Q3 2024 | Q2 2024 |
|---|---|---|---|---|
| EPS Estimate | 0.74 | 0.90 | 0.88 | 0.83 |
| EPS Actual | 0.72 | 0.92 | 0.89 | 0.85 |
| Price Change % | -1.0% | 6.0% | -5.0% | 2.0% |
Tracking SLB's Stock Performance
Shares of SLB were trading at $34.59 as of July 16. Over the last 52-week period, shares are down 30.14%. Given that these returns are generally negative, long-term shareholders are likely bearish going into this earnings release.
Insights Shared by Analysts on SLB
Understanding market sentiments and expectations within the industry is crucial for investors. This analysis delves into the latest insights on SLB.
SLB has received a total of 12 ratings from analysts, with the consensus rating as Outperform. With an average one-year price target of $47.08, the consensus suggests a potential 36.11% upside.
Peer Ratings Comparison
The following analysis focuses on the analyst ratings and average 1-year price targets of Baker Hughes, Halliburton and TechnipFMC, three prominent industry players, providing insights into their relative performance expectations and market positioning.
- Analysts currently favor an Outperform trajectory for Baker Hughes, with an average 1-year price target of $46.91, suggesting a potential 35.62% upside.
- Analysts currently favor an Buy trajectory for Halliburton, with an average 1-year price target of $27.27, suggesting a potential 21.16% downside.
- Analysts currently favor an Outperform trajectory for TechnipFMC, with an average 1-year price target of $40.75, suggesting a potential 17.81% upside.
Peers Comparative Analysis Summary
The peer analysis summary provides a snapshot of key metrics for Baker Hughes, Halliburton and TechnipFMC, illuminating their respective standings within the industry. These metrics offer valuable insights into their market positions and comparative performance.
| Company | Consensus | Revenue Growth | Gross Profit | Return on Equity |
|---|---|---|---|---|
| SLB | Outperform | -2.49% | $1.61B | 3.92% |
| Baker Hughes | Outperform | 0.14% | $1.48B | 2.37% |
| Halliburton | Buy | -6.67% | $879M | 1.95% |
| TechnipFMC | Outperform | 9.38% | $464.90M | 4.61% |
Key Takeaway:
SLB ranks at the bottom for Revenue Growth and Gross Profit, with negative growth rates and lower profit figures compared to peers. SLB also has the lowest Return on Equity among the group. Overall, SLB's performance lags behind its peers in key financial metrics.
Unveiling the Story Behind SLB
SLB is the world's premier oilfield-services company as measured by market share. While the industry is mostly fragmented, SLB holds the first or second competitive position in many of the differentiated oligopolies it operates in. Also known as Schlumberger, the company was founded in 1926 by two brothers bearing the same last name. Today it's most known as a global industry leader in innovation, while it focuses its strategy on its three growth engines: its core, digital, and new energy businesses. Over three fourths of its revenue base is tied to international markets, while the company boasts roughly $3 billion in digital-related revenue.
SLB: A Financial Overview
Market Capitalization: Exceeding industry standards, the company's market capitalization places it above industry average in size relative to peers. This emphasizes its significant scale and robust market position.
Decline in Revenue: Over the 3 months period, SLB faced challenges, resulting in a decline of approximately -2.49% in revenue growth as of 31 March, 2025. This signifies a reduction in the company's top-line earnings. When compared to others in the Energy sector, the company faces challenges, achieving a growth rate lower than the average among peers.
Net Margin: SLB's financial strength is reflected in its exceptional net margin, which exceeds industry averages. With a remarkable net margin of 9.39%, the company showcases strong profitability and effective cost management.
Return on Equity (ROE): The company's ROE is a standout performer, exceeding industry averages. With an impressive ROE of 3.92%, the company showcases effective utilization of equity capital.
Return on Assets (ROA): The company's ROA is a standout performer, exceeding industry averages. With an impressive ROA of 1.63%, the company showcases effective utilization of assets.
Debt Management: The company faces challenges in debt management with a debt-to-equity ratio higher than the industry average. With a ratio of 0.72, caution is advised due to increased financial risk.
To track all earnings releases for SLB visit their earnings calendar on our site.
This article was generated by Benzinga's automated content engine and reviewed by an editor.