Earnings Preview For Raymond James Finl
Raymond James Finl (NYSE:RJF) is preparing to release its quarterly earnings on Wednesday, 2025-07-23. Here's a brief overview of what investors should keep in mind before the announcement.
Analysts expect Raymond James Finl to report an earnings per share (EPS) of $2.37.
The announcement from Raymond James Finl is eagerly anticipated, with investors seeking news of surpassing estimates and favorable guidance for the next quarter.
It's worth noting for new investors that guidance can be a key determinant of stock price movements.
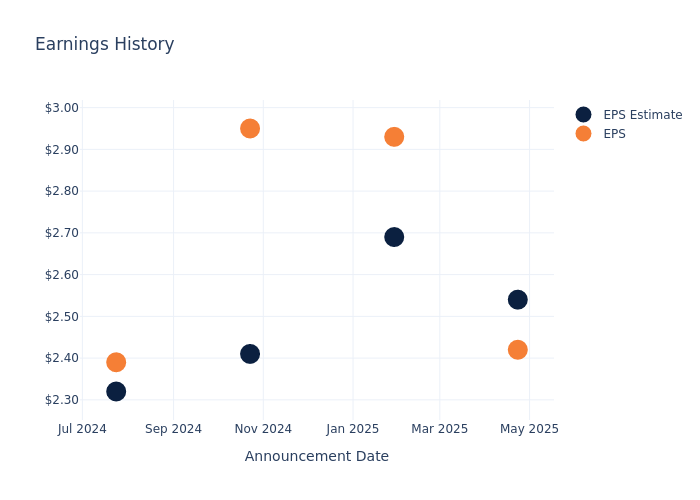
Earnings History Snapshot
During the last quarter, the company reported an EPS missed by $0.12, leading to a 1.43% increase in the share price on the subsequent day.
Here's a look at Raymond James Finl's past performance and the resulting price change:
| Quarter | Q2 2025 | Q1 2025 | Q4 2024 | Q3 2024 |
|---|---|---|---|---|
| EPS Estimate | 2.54 | 2.69 | 2.41 | 2.32 |
| EPS Actual | 2.42 | 2.93 | 2.95 | 2.39 |
| Price Change % | 1.0% | -1.0% | 7.000000000000001% | 5.0% |
Tracking Raymond James Finl's Stock Performance
Shares of Raymond James Finl were trading at $159.38 as of July 21. Over the last 52-week period, shares are up 42.43%. Given that these returns are generally positive, long-term shareholders are likely bullish going into this earnings release.
Analyst Opinions on Raymond James Finl
For investors, grasping market sentiments and expectations in the industry is vital. This analysis explores the latest insights regarding Raymond James Finl.
Analysts have provided Raymond James Finl with 7 ratings, resulting in a consensus rating of Neutral. The average one-year price target stands at $165.29, suggesting a potential 3.71% upside.
Comparing Ratings Among Industry Peers
The following analysis focuses on the analyst ratings and average 1-year price targets of and Interactive Brokers Group, three prominent industry players, providing insights into their relative performance expectations and market positioning.
- Analysts currently favor an Outperform trajectory for Interactive Brokers Group, with an average 1-year price target of $112.29, suggesting a potential 29.55% downside.
Key Findings: Peer Analysis Summary
The peer analysis summary outlines pivotal metrics for and Interactive Brokers Group, demonstrating their respective standings within the industry and offering valuable insights into their market positions and comparative performance.
| Company | Consensus | Revenue Growth | Gross Profit | Return on Equity |
|---|---|---|---|---|
| LPL Finl Hldgs | Outperform | 29.56% | $966.40M | 10.52% |
| Interactive Brokers Group | Outperform | 6.88% | $2.04B | 4.80% |
Key Takeaway:
Raymond James Finl ranks higher than peers in Revenue Growth and Gross Profit, indicating strong financial performance in these areas. However, it lags behind in Return on Equity compared to peers. Overall, Raymond James Finl is positioned in the middle among its peers based on the provided metrics.
Discovering Raymond James Finl: A Closer Look
Raymond James Financial is a diversified financial services firm that provides wealth management, investment banking, asset management, and capital markets services to individuals, corporations, and municipalities. The firm maintains an extensive catalogue of products and services across its business lines. However, the wealth management franchise generates the bulk of its revenues and earnings through a vast network of nearly 8,800 independent and employee-affiliated advisors, who collectively manage over $1.5 trillion in client assets as of fiscal year-end 2024. While Raymond James maintains a global footprint, the company derives over 90% of its revenues, and an even larger percentage of its operating income, from the United States.
Understanding the Numbers: Raymond James Finl's Finances
Market Capitalization: Surpassing industry standards, the company's market capitalization asserts its dominance in terms of size, suggesting a robust market position.
Revenue Growth: Raymond James Finl's remarkable performance in 3 months is evident. As of 31 March, 2025, the company achieved an impressive revenue growth rate of 8.95%. This signifies a substantial increase in the company's top-line earnings. In comparison to its industry peers, the company trails behind with a growth rate lower than the average among peers in the Financials sector.
Net Margin: Raymond James Finl's net margin lags behind industry averages, suggesting challenges in maintaining strong profitability. With a net margin of 14.69%, the company may face hurdles in effective cost management.
Return on Equity (ROE): Raymond James Finl's ROE is below industry averages, indicating potential challenges in efficiently utilizing equity capital. With an ROE of 4.1%, the company may face hurdles in achieving optimal financial returns.
Return on Assets (ROA): Raymond James Finl's ROA is below industry standards, pointing towards difficulties in efficiently utilizing assets. With an ROA of 0.59%, the company may encounter challenges in delivering satisfactory returns from its assets.
Debt Management: The company maintains a balanced debt approach with a debt-to-equity ratio below industry norms, standing at 0.24.
To track all earnings releases for Raymond James Finl visit their earnings calendar on our site.
This article was generated by Benzinga's automated content engine and reviewed by an editor.