Las Vegas Sands's Earnings Outlook
Las Vegas Sands (NYSE:LVS) will release its quarterly earnings report on Wednesday, 2025-07-23. Here's a brief overview for investors ahead of the announcement.
Analysts anticipate Las Vegas Sands to report an earnings per share (EPS) of $0.53.
The market awaits Las Vegas Sands's announcement, with hopes high for news of surpassing estimates and providing upbeat guidance for the next quarter.
It's important for new investors to understand that guidance can be a significant driver of stock prices.
Performance in Previous Earnings
The company's EPS beat by $0.01 in the last quarter, leading to a 6.49% increase in the share price on the following day.
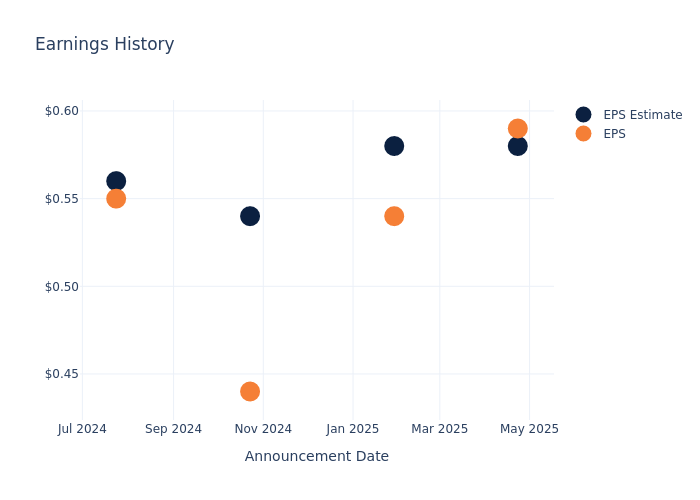
Here's a look at Las Vegas Sands's past performance and the resulting price change:
| Quarter | Q1 2025 | Q4 2024 | Q3 2024 | Q2 2024 |
|---|---|---|---|---|
| EPS Estimate | 0.58 | 0.58 | 0.54 | 0.56 |
| EPS Actual | 0.59 | 0.54 | 0.44 | 0.55 |
| Price Change % | 6.0% | 11.0% | 3.0% | -2.0% |
Tracking Las Vegas Sands's Stock Performance
Shares of Las Vegas Sands were trading at $48.27 as of July 21. Over the last 52-week period, shares are up 19.07%. Given that these returns are generally positive, long-term shareholders are likely bullish going into this earnings release.
Analysts' Take on Las Vegas Sands
Understanding market sentiments and expectations within the industry is crucial for investors. This analysis delves into the latest insights on Las Vegas Sands.
The consensus rating for Las Vegas Sands is Neutral, derived from 9 analyst ratings. An average one-year price target of $52.11 implies a potential 7.96% upside.
Understanding Analyst Ratings Among Peers
In this analysis, we delve into the analyst ratings and average 1-year price targets of DraftKings, MGM Resorts International and Light & Wonder, three key industry players, offering insights into their relative performance expectations and market positioning.
- Analysts currently favor an Buy trajectory for DraftKings, with an average 1-year price target of $53.91, suggesting a potential 11.68% upside.
- Analysts currently favor an Buy trajectory for MGM Resorts International, with an average 1-year price target of $44.69, suggesting a potential 7.42% downside.
- Analysts currently favor an Buy trajectory for Light & Wonder, with an average 1-year price target of $108.71, suggesting a potential 125.21% upside.
Summary of Peers Analysis
The peer analysis summary offers a detailed examination of key metrics for DraftKings, MGM Resorts International and Light & Wonder, providing valuable insights into their respective standings within the industry and their market positions and comparative performance.
| Company | Consensus | Revenue Growth | Gross Profit | Return on Equity |
|---|---|---|---|---|
| Las Vegas Sands | Neutral | -3.28% | $1.42B | 12.61% |
| DraftKings | Buy | 19.90% | $565.00M | -3.60% |
| MGM Resorts International | Buy | -2.43% | $1.96B | 5.05% |
| Light & Wonder | Buy | 2.38% | $563M | 13.06% |
Key Takeaway:
Las Vegas Sands ranks at the bottom for Revenue Growth among its peers. It is in the middle for Gross Profit. For Return on Equity, it is at the top.
Delving into Las Vegas Sands's Background
Las Vegas Sands is the world's largest operator of fully integrated resorts, featuring casino, hotel, entertainment, food and beverage, retail, and convention center operations. The company owns the Venetian Macao, Sands Macao, Londoner Macao, Four Seasons Hotel Macao, and Parisian Macao, as well as the Marina Bay Sands resort in Singapore. We expect Sands to open a fourth tower in Singapore in 2031. Its Venetian and Palazzo Las Vegas assets in the US were sold to Apollo and Vici in 2022. After the sale of its Vegas assets, the company generates all its EBITDA from Asia, with its casino operations generating the majority of sales.
Key Indicators: Las Vegas Sands's Financial Health
Market Capitalization: Exceeding industry standards, the company's market capitalization places it above industry average in size relative to peers. This emphasizes its significant scale and robust market position.
Decline in Revenue: Over the 3 months period, Las Vegas Sands faced challenges, resulting in a decline of approximately -3.28% in revenue growth as of 31 March, 2025. This signifies a reduction in the company's top-line earnings. As compared to its peers, the revenue growth lags behind its industry peers. The company achieved a growth rate lower than the average among peers in Consumer Discretionary sector.
Net Margin: Las Vegas Sands's net margin is impressive, surpassing industry averages. With a net margin of 12.3%, the company demonstrates strong profitability and effective cost management.
Return on Equity (ROE): Las Vegas Sands's ROE excels beyond industry benchmarks, reaching 12.61%. This signifies robust financial management and efficient use of shareholder equity capital.
Return on Assets (ROA): Las Vegas Sands's financial strength is reflected in its exceptional ROA, which exceeds industry averages. With a remarkable ROA of 1.68%, the company showcases efficient use of assets and strong financial health.
Debt Management: Las Vegas Sands's debt-to-equity ratio is notably higher than the industry average. With a ratio of 5.13, the company relies more heavily on borrowed funds, indicating a higher level of financial risk.
To track all earnings releases for Las Vegas Sands visit their earnings calendar on our site.
This article was generated by Benzinga's automated content engine and reviewed by an editor.