A Glimpse of Virtus Inv's Earnings Potential
Virtus Inv (NASDAQ:VRTS) is gearing up to announce its quarterly earnings on Friday, 2025-07-25. Here's a quick overview of what investors should know before the release.
Analysts are estimating that Virtus Inv will report an earnings per share (EPS) of $6.17.
Investors in Virtus Inv are eagerly awaiting the company's announcement, hoping for news of surpassing estimates and positive guidance for the next quarter.
It's worth noting for new investors that stock prices can be heavily influenced by future projections rather than just past performance.
Historical Earnings Performance
Last quarter the company beat EPS by $0.32, which was followed by a 0.0% drop in the share price the next day.
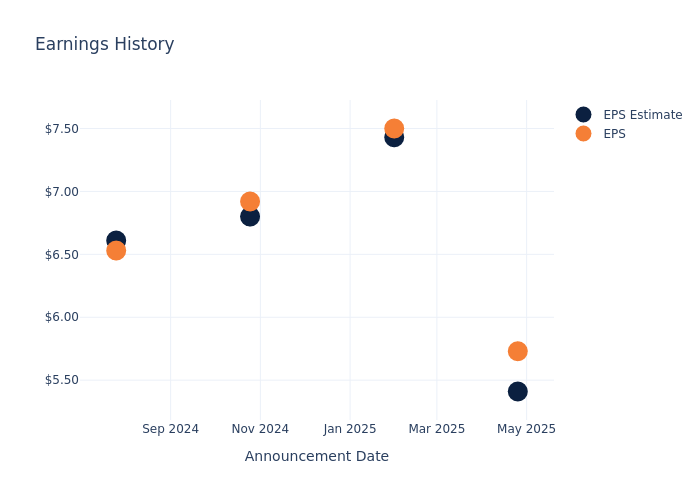
Here's a look at Virtus Inv's past performance and the resulting price change:
| Quarter | Q1 2025 | Q4 2024 | Q3 2024 | Q2 2024 |
|---|---|---|---|---|
| EPS Estimate | 5.41 | 7.43 | 6.80 | 6.61 |
| EPS Actual | 5.73 | 7.50 | 6.92 | 6.53 |
| Price Change % | -2.0% | -6.0% | 0.0% | -5.0% |
Performance of Virtus Inv Shares
Shares of Virtus Inv were trading at $213.98 as of July 23. Over the last 52-week period, shares are down 9.59%. Given that these returns are generally negative, long-term shareholders are likely unhappy going into this earnings release.
Analyst Opinions on Virtus Inv
For investors, grasping market sentiments and expectations in the industry is vital. This analysis explores the latest insights regarding Virtus Inv.
The consensus rating for Virtus Inv is Underperform, based on 5 analyst ratings. With an average one-year price target of $179.4, there's a potential 16.16% downside.
Understanding Analyst Ratings Among Peers
This comparison focuses on the analyst ratings and average 1-year price targets of Acadian Asset Management, P10 and DigitalBridge Gr, three major players in the industry, shedding light on their relative performance expectations and market positioning.
- Analysts currently favor an Neutral trajectory for Acadian Asset Management, with an average 1-year price target of $30.33, suggesting a potential 85.83% downside.
- Analysts currently favor an Outperform trajectory for P10, with an average 1-year price target of $16.5, suggesting a potential 92.29% downside.
- Analysts currently favor an Buy trajectory for DigitalBridge Gr, with an average 1-year price target of $13.83, suggesting a potential 93.54% downside.
Summary of Peers Analysis
Within the peer analysis summary, vital metrics for Acadian Asset Management, P10 and DigitalBridge Gr are presented, shedding light on their respective standings within the industry and offering valuable insights into their market positions and comparative performance.
| Company | Consensus | Revenue Growth | Gross Profit | Return on Equity |
|---|---|---|---|---|
| Virtus Inv | Underperform | -1.91% | $107.76M | 3.20% |
| Acadian Asset Management | Neutral | 13.43% | $58.40M | 96.40% |
| P10 | Outperform | 2.35% | $30.59M | 1.33% |
| DigitalBridge Gr | Buy | -38.91% | $67.75M | -0.08% |
Key Takeaway:
Virtus Inv ranks at the bottom for Revenue Growth and Gross Profit, while it is in the middle for Return on Equity.
All You Need to Know About Virtus Inv
Virtus Investment Partners Inc provides investment management and related services to institutions and individuals. It uses a multi-manager, multi-style approach, offering investment strategies from investment managers, each having its distinct investment style, autonomous investment process, and individual brand, as well as from select unaffiliated managers for certain funds. Through its multi-manager model, the group provides investment managers with distribution, business, and operational support. The Company operates in one business segment, namely as an asset manager providing investment management and related services for individual and institutional clients.
Financial Insights: Virtus Inv
Market Capitalization Analysis: The company exhibits a lower market capitalization profile, positioning itself below industry averages. This suggests a smaller scale relative to peers.
Revenue Challenges: Virtus Inv's revenue growth over 3 months faced difficulties. As of 31 March, 2025, the company experienced a decline of approximately -1.91%. This indicates a decrease in top-line earnings. As compared to competitors, the company surpassed expectations with a growth rate higher than the average among peers in the Financials sector.
Net Margin: Virtus Inv's net margin lags behind industry averages, suggesting challenges in maintaining strong profitability. With a net margin of 13.21%, the company may face hurdles in effective cost management.
Return on Equity (ROE): Virtus Inv's ROE falls below industry averages, indicating challenges in efficiently using equity capital. With an ROE of 3.2%, the company may face hurdles in generating optimal returns for shareholders.
Return on Assets (ROA): Virtus Inv's ROA lags behind industry averages, suggesting challenges in maximizing returns from its assets. With an ROA of 0.75%, the company may face hurdles in achieving optimal financial performance.
Debt Management: With a high debt-to-equity ratio of 2.62, Virtus Inv faces challenges in effectively managing its debt levels, indicating potential financial strain.
To track all earnings releases for Virtus Inv visit their earnings calendar on our site.
This article was generated by Benzinga's automated content engine and reviewed by an editor.