An Overview of Arthur J. Gallagher's Earnings
Arthur J. Gallagher (NYSE:AJG) is preparing to release its quarterly earnings on Thursday, 2025-07-31. Here's a brief overview of what investors should keep in mind before the announcement.
Analysts expect Arthur J. Gallagher to report an earnings per share (EPS) of $2.36.
Anticipation surrounds Arthur J. Gallagher's announcement, with investors hoping to hear about both surpassing estimates and receiving positive guidance for the next quarter.
New investors should understand that while earnings performance is important, market reactions are often driven by guidance.
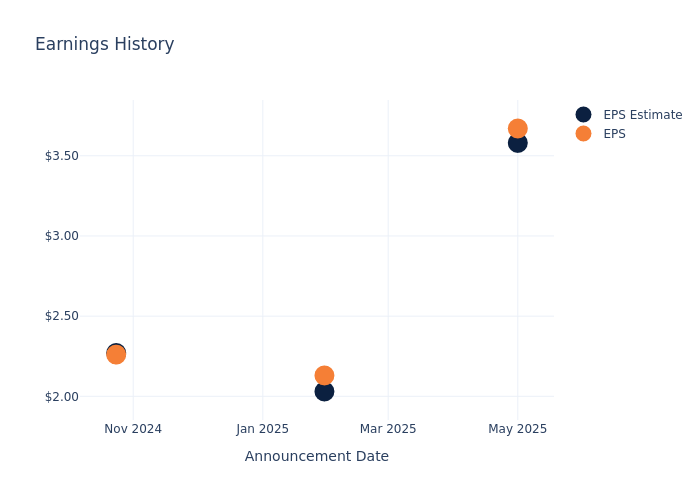
Historical Earnings Performance
During the last quarter, the company reported an EPS beat by $0.09, leading to a 4.23% increase in the share price on the subsequent day.
Here's a look at Arthur J. Gallagher's past performance and the resulting price change:
| Quarter | Q1 2025 | Q4 2024 | Q3 2024 | Q2 2024 |
|---|---|---|---|---|
| EPS Estimate | 3.58 | 2.03 | 2.27 | 2.24 |
| EPS Actual | 3.67 | 2.13 | 2.26 | 2.26 |
| Price Change % | 4.0% | 1.0% | -2.0% | 4.0% |
Tracking Arthur J. Gallagher's Stock Performance
Shares of Arthur J. Gallagher were trading at $288.35 as of July 29. Over the last 52-week period, shares are up 0.42%. Given that these returns are generally positive, long-term shareholders are likely bullish going into this earnings release.
Analyst Insights on Arthur J. Gallagher
For investors, staying informed about market sentiments and expectations in the industry is paramount. This analysis provides an exploration of the latest insights on Arthur J. Gallagher.
Analysts have given Arthur J. Gallagher a total of 5 ratings, with the consensus rating being Neutral. The average one-year price target is $333.8, indicating a potential 15.76% upside.
Analyzing Ratings Among Peers
In this analysis, we delve into the analyst ratings and average 1-year price targets of Aon, Marsh & McLennan Cos and Brown & Brown, three key industry players, offering insights into their relative performance expectations and market positioning.
- Analysts currently favor an Outperform trajectory for Aon, with an average 1-year price target of $417.83, suggesting a potential 44.9% upside.
- Analysts currently favor an Neutral trajectory for Marsh & McLennan Cos, with an average 1-year price target of $228.33, suggesting a potential 20.81% downside.
- Analysts currently favor an Neutral trajectory for Brown & Brown, with an average 1-year price target of $112.7, suggesting a potential 60.92% downside.
Snapshot: Peer Analysis
The peer analysis summary offers a detailed examination of key metrics for Aon, Marsh & McLennan Cos and Brown & Brown, providing valuable insights into their respective standings within the industry and their market positions and comparative performance.
| Company | Consensus | Revenue Growth | Gross Profit | Return on Equity |
|---|---|---|---|---|
| Arthur J. Gallagher | Neutral | 14.45% | $1.79B | 3.32% |
| Aon | Outperform | 10.51% | $1.79B | 7.80% |
| Marsh & McLennan Cos | Neutral | 12.10% | $3.08B | 8.12% |
| Brown & Brown | Neutral | 8.23% | $609M | 2.48% |
Key Takeaway:
Arthur J. Gallagher ranks in the middle for Consensus rating. It is at the bottom for Revenue Growth and Gross Profit, but at the top for Return on Equity among its peers.
Get to Know Arthur J. Gallagher Better
Founded in 1927 as a one-person agency, Gallagher's primary business is insurance brokerage, with a focus on serving middle-market companies. The company's risk management segment provides third-party claims adjustment to companies that choose to self-insure. Gallagher has about 56,000 employees and generates about a third of its revenue internationally, primarily in Australia, Canada, New Zealand, and the UK.
Arthur J. Gallagher's Financial Performance
Market Capitalization: Exceeding industry standards, the company's market capitalization places it above industry average in size relative to peers. This emphasizes its significant scale and robust market position.
Positive Revenue Trend: Examining Arthur J. Gallagher's financials over 3 months reveals a positive narrative. The company achieved a noteworthy revenue growth rate of 14.45% as of 31 March, 2025, showcasing a substantial increase in top-line earnings. In comparison to its industry peers, the company trails behind with a growth rate lower than the average among peers in the Financials sector.
Net Margin: The company's net margin is a standout performer, exceeding industry averages. With an impressive net margin of 18.9%, the company showcases strong profitability and effective cost control.
Return on Equity (ROE): Arthur J. Gallagher's ROE excels beyond industry benchmarks, reaching 3.32%. This signifies robust financial management and efficient use of shareholder equity capital.
Return on Assets (ROA): Arthur J. Gallagher's ROA stands out, surpassing industry averages. With an impressive ROA of 1.02%, the company demonstrates effective utilization of assets and strong financial performance.
Debt Management: The company maintains a balanced debt approach with a debt-to-equity ratio below industry norms, standing at 0.6.
To track all earnings releases for Arthur J. Gallagher visit their earnings calendar on our site.
This article was generated by Benzinga's automated content engine and reviewed by an editor.