A Preview Of Performant Healthcare's Earnings
Performant Healthcare (NASDAQ:PHLT) is gearing up to announce its quarterly earnings on Thursday, 2025-08-07. Here's a quick overview of what investors should know before the release.
Analysts are estimating that Performant Healthcare will report an earnings per share (EPS) of $-0.02.
Anticipation surrounds Performant Healthcare's announcement, with investors hoping to hear about both surpassing estimates and receiving positive guidance for the next quarter.
New investors should understand that while earnings performance is important, market reactions are often driven by guidance.
Performance in Previous Earnings
The company's EPS beat by $0.04 in the last quarter, leading to a 10.67% increase in the share price on the following day.
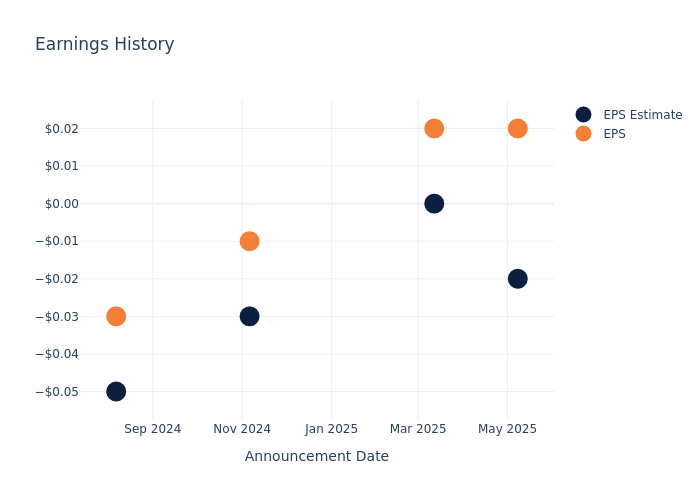
Here's a look at Performant Healthcare's past performance and the resulting price change:
| Quarter | Q1 2025 | Q4 2024 | Q3 2024 | Q2 2024 |
|---|---|---|---|---|
| EPS Estimate | -0.02 | 0 | -0.03 | -0.05 |
| EPS Actual | 0.02 | 0.02 | -0.01 | -0.03 |
| Price Change % | 11.0% | 10.0% | -15.0% | 11.0% |
Performance of Performant Healthcare Shares
Shares of Performant Healthcare were trading at $7.62 as of August 05. Over the last 52-week period, shares are up 108.9%. Given that these returns are generally positive, long-term shareholders are likely bullish going into this earnings release.
Analysts' Perspectives on Performant Healthcare
Understanding market sentiments and expectations within the industry is crucial for investors. This analysis delves into the latest insights on Performant Healthcare.
Analysts have provided Performant Healthcare with 2 ratings, resulting in a consensus rating of Neutral. The average one-year price target stands at $7.88, suggesting a potential 3.41% upside.
Peer Ratings Overview
This comparison focuses on the analyst ratings and average 1-year price targets of Fulgent Genetics, AMN Healthcare Services and Nutex Health, three major players in the industry, shedding light on their relative performance expectations and market positioning.
- Analysts currently favor an Buy trajectory for Fulgent Genetics, with an average 1-year price target of $25.5, suggesting a potential 234.65% upside.
- Analysts currently favor an Neutral trajectory for AMN Healthcare Services, with an average 1-year price target of $25.5, suggesting a potential 234.65% upside.
- Analysts currently favor an Buy trajectory for Nutex Health, with an average 1-year price target of $262.5, suggesting a potential 3344.88% upside.
Analysis Summary for Peers
The peer analysis summary provides a snapshot of key metrics for Fulgent Genetics, AMN Healthcare Services and Nutex Health, illuminating their respective standings within the industry. These metrics offer valuable insights into their market positions and comparative performance.
| Company | Consensus | Revenue Growth | Gross Profit | Return on Equity |
|---|---|---|---|---|
| Castle Biosciences | Outperform | -0.94% | $68.56M | 1.01% |
| Fulgent Genetics | Buy | 15.17% | $34.44M | -1.69% |
| AMN Healthcare Services | Neutral | -16.00% | $198.12M | -0.15% |
| Nutex Health | Buy | 213.98% | $118.34M | 8.52% |
Key Takeaway:
Performant Healthcare ranks at the bottom for Revenue Growth, with a negative growth rate compared to positive growth rates of its peers. It also lags behind in Gross Profit, having a lower figure than most peers. In terms of Return on Equity, Performant Healthcare is at the bottom with a negative percentage, while some peers have positive returns. Overall, Performant Healthcare is positioned lower compared to its peers across key financial metrics.
Discovering Performant Healthcare: A Closer Look
Performant Healthcare Inc provides solutions to payers in the healthcare industry to identify, prevent, and recover waste and improper payments by leveraging technology, analytics, and proprietary data assets.
Performant Healthcare's Economic Impact: An Analysis
Market Capitalization: With restricted market capitalization, the company is positioned below industry averages. This reflects a smaller scale relative to peers.
Revenue Growth: Performant Healthcare displayed positive results in 3 months. As of 31 March, 2025, the company achieved a solid revenue growth rate of approximately 21.71%. This indicates a notable increase in the company's top-line earnings. As compared to its peers, the company achieved a growth rate higher than the average among peers in Health Care sector.
Net Margin: Performant Healthcare's net margin surpasses industry standards, highlighting the company's exceptional financial performance. With an impressive -0.24% net margin, the company effectively manages costs and achieves strong profitability.
Return on Equity (ROE): Performant Healthcare's ROE stands out, surpassing industry averages. With an impressive ROE of -0.1%, the company demonstrates effective use of equity capital and strong financial performance.
Return on Assets (ROA): The company's ROA is a standout performer, exceeding industry averages. With an impressive ROA of -0.08%, the company showcases effective utilization of assets.
Debt Management: Performant Healthcare's debt-to-equity ratio is below the industry average. With a ratio of 0.11, the company relies less on debt financing, maintaining a healthier balance between debt and equity, which can be viewed positively by investors.
To track all earnings releases for Performant Healthcare visit their earnings calendar on our site.
This article was generated by Benzinga's automated content engine and reviewed by an editor.