Investigating Microsoft's Standing In Software Industry Compared To Competitors

In today's rapidly evolving and fiercely competitive business landscape, it is crucial for investors and industry analysts to conduct comprehensive company evaluations. In this article, we will undertake an in-depth industry comparison, assessing Microsoft (NASDAQ:MSFT) alongside its primary competitors in the Software industry. By meticulously examining crucial financial indicators, market positioning, and growth potential, we aim to provide valuable insights to investors and shed light on company's performance within the industry.
Microsoft Background
Microsoft develops and licenses consumer and enterprise software. It is known for its Windows operating systems and Office productivity suite. The company is organized into three equally sized broad segments: productivity and business processes (legacy Microsoft Office, cloud-based Office 365, Exchange, SharePoint, Skype, LinkedIn, Dynamics), intelligence cloud (infrastructure- and platform-as-a-service offerings Azure, Windows Server OS, SQL Server), and more personal computing (Windows Client, Xbox, Bing search, display advertising, and Surface laptops, tablets, and desktops).
| Company | P/E | P/B | P/S | ROE | EBITDA (in billions) | Gross Profit (in billions) | Revenue Growth |
|---|---|---|---|---|---|---|---|
| Microsoft Corp | 39.09 | 11.68 | 13.99 | 8.27% | $40.71 | $48.15 | 13.27% |
| Oracle Corp | 54.14 | 32.27 | 11.73 | 18.43% | $6.83 | $11.16 | 11.31% |
| ServiceNow Inc | 129.84 | 19.55 | 17.43 | 4.66% | $0.72 | $2.44 | 18.63% |
| Palo Alto Networks Inc | 110.49 | 17.73 | 15.35 | 3.85% | $0.4 | $1.67 | 15.33% |
| Fortinet Inc | 43.18 | 40.92 | 13.21 | 25.08% | $0.56 | $1.25 | 13.77% |
| Gen Digital Inc | 29.04 | 8.18 | 4.74 | 6.43% | $0.53 | $0.81 | 4.77% |
| Monday.Com Ltd | 284.21 | 13.27 | 14.43 | 2.57% | $0.01 | $0.25 | 30.12% |
| CommVault Systems Inc | 99.24 | 22.83 | 7.57 | 10.11% | $0.03 | $0.23 | 23.17% |
| Dolby Laboratories Inc | 28.16 | 2.77 | 5.49 | 3.61% | $0.14 | $0.33 | 1.38% |
| Qualys Inc | 28.16 | 10.04 | 8.22 | 9.75% | $0.06 | $0.13 | 9.67% |
| Progress Software Corp | 36.66 | 4.54 | 2.44 | 3.85% | $0.08 | $0.19 | 35.57% |
| Teradata Corp | 15.11 | 12.89 | 1.22 | 30.24% | $0.09 | $0.25 | -10.11% |
| N-able Inc | 98.25 | 1.92 | 3.15 | -0.93% | $0.01 | $0.09 | 3.91% |
| Rapid7 Inc | 54.95 | 27.45 | 1.67 | 5.98% | $0.02 | $0.15 | 2.51% |
| Average | 77.8 | 16.49 | 8.2 | 9.51% | $0.73 | $1.46 | 12.31% |
By analyzing Microsoft, we can infer the following trends:
-
A Price to Earnings ratio of 39.09 significantly below the industry average by 0.5x suggests undervaluation. This can make the stock appealing for those seeking growth.
-
Considering a Price to Book ratio of 11.68, which is well below the industry average by 0.71x, the stock may be undervalued based on its book value compared to its peers.
-
With a relatively high Price to Sales ratio of 13.99, which is 1.71x the industry average, the stock might be considered overvalued based on sales performance.
-
With a Return on Equity (ROE) of 8.27% that is 1.24% below the industry average, it appears that the company exhibits potential inefficiency in utilizing equity to generate profits.
-
The Earnings Before Interest, Taxes, Depreciation, and Amortization (EBITDA) of $40.71 Billion is 55.77x above the industry average, highlighting stronger profitability and robust cash flow generation.
-
The gross profit of $48.15 Billion is 32.98x above that of its industry, highlighting stronger profitability and higher earnings from its core operations.
-
The company's revenue growth of 13.27% is notably higher compared to the industry average of 12.31%, showcasing exceptional sales performance and strong demand for its products or services.
Debt To Equity Ratio
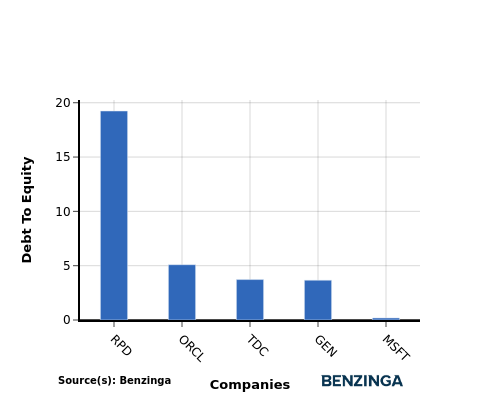
The debt-to-equity (D/E) ratio gauges the extent to which a company has financed its operations through debt relative to equity.
Considering the debt-to-equity ratio in industry comparisons allows for a concise evaluation of a company's financial health and risk profile, aiding in informed decision-making.
When assessing Microsoft against its top 4 peers using the Debt-to-Equity ratio, the following comparisons can be made:
-
Microsoft exhibits a stronger financial position compared to its top 4 peers in the sector, as indicated by its lower debt-to-equity ratio of 0.19.
-
This suggests that the company has a more favorable balance between debt and equity, which can be seen as a positive aspect for investors.
Key Takeaways
For Microsoft in the Software industry, the PE and PB ratios suggest that the stock is undervalued compared to its peers. However, the high PS ratio indicates that the market values its sales more highly. In terms of ROE, Microsoft's performance is weaker than its peers, while its high EBITDA and gross profit margins indicate strong operational efficiency. Additionally, the high revenue growth suggests that Microsoft is expanding rapidly compared to industry competitors.
This article was generated by Benzinga's automated content engine and reviewed by an editor.
Posted-In: BZI-IANews Markets Trading Ideas