Analyzing Microsoft In Comparison To Competitors In Software Industry

In the dynamic and cutthroat world of business, conducting thorough company analysis is essential for investors and industry experts. In this article, we will undertake a comprehensive industry comparison, evaluating Microsoft (NASDAQ:MSFT) and its primary competitors in the Software industry. By closely examining key financial metrics, market position, and growth prospects, our aim is to provide valuable insights for investors and shed light on company's performance within the industry.
Microsoft Background
Microsoft develops and licenses consumer and enterprise software. It is known for its Windows operating systems and Office productivity suite. The company is organized into three equally sized broad segments: productivity and business processes (legacy Microsoft Office, cloud-based Office 365, Exchange, SharePoint, Skype, LinkedIn, Dynamics), intelligence cloud (infrastructure- and platform-as-a-service offerings Azure, Windows Server OS, SQL Server), and more personal computing (Windows Client, Xbox, Bing search, display advertising, and Surface laptops, tablets, and desktops).
| Company | P/E | P/B | P/S | ROE | EBITDA (in billions) | Gross Profit (in billions) | Revenue Growth |
|---|---|---|---|---|---|---|---|
| Microsoft Corp | 39.07 | 11.67 | 13.99 | 8.27% | $40.71 | $48.15 | 13.27% |
| Oracle Corp | 55.60 | 33.14 | 12.05 | 18.43% | $6.83 | $11.16 | 11.31% |
| ServiceNow Inc | 131.20 | 19.76 | 17.61 | 4.66% | $0.72 | $2.44 | 18.63% |
| Palo Alto Networks Inc | 110.68 | 17.76 | 15.37 | 3.85% | $0.4 | $1.67 | 15.33% |
| Fortinet Inc | 42.57 | 40.34 | 13.03 | 25.08% | $0.56 | $1.25 | 13.77% |
| Gen Digital Inc | 29.15 | 8.21 | 4.76 | 6.43% | $0.53 | $0.81 | 4.77% |
| Monday.Com Ltd | 287.05 | 13.40 | 14.58 | 2.57% | $0.01 | $0.25 | 30.12% |
| CommVault Systems Inc | 100.49 | 23.12 | 7.66 | 10.11% | $0.03 | $0.23 | 23.17% |
| Dolby Laboratories Inc | 28.41 | 2.80 | 5.54 | 3.61% | $0.14 | $0.33 | 1.38% |
| Qualys Inc | 28.32 | 10.10 | 8.27 | 9.75% | $0.06 | $0.13 | 9.67% |
| Progress Software Corp | 37.32 | 4.62 | 2.48 | 3.85% | $0.08 | $0.19 | 35.57% |
| Teradata Corp | 15.26 | 13.02 | 1.23 | 30.24% | $0.09 | $0.25 | -10.11% |
| N-able Inc | 99.62 | 1.94 | 3.20 | -0.93% | $0.01 | $0.09 | 3.91% |
| Rapid7 Inc | 55.02 | 27.49 | 1.68 | 5.98% | $0.02 | $0.15 | 2.51% |
| Average | 78.51 | 16.59 | 8.27 | 9.51% | $0.73 | $1.46 | 12.31% |
When analyzing Microsoft, the following trends become evident:
-
The stock's Price to Earnings ratio of 39.07 is lower than the industry average by 0.5x, suggesting potential value in the eyes of market participants.
-
The current Price to Book ratio of 11.67, which is 0.7x the industry average, is substantially lower than the industry average, indicating potential undervaluation.
-
The Price to Sales ratio of 13.99, which is 1.69x the industry average, suggests the stock could potentially be overvalued in relation to its sales performance compared to its peers.
-
The company has a lower Return on Equity (ROE) of 8.27%, which is 1.24% below the industry average. This indicates potential inefficiency in utilizing equity to generate profits, which could be attributed to various factors.
-
The Earnings Before Interest, Taxes, Depreciation, and Amortization (EBITDA) of $40.71 Billion is 55.77x above the industry average, highlighting stronger profitability and robust cash flow generation.
-
The gross profit of $48.15 Billion is 32.98x above that of its industry, highlighting stronger profitability and higher earnings from its core operations.
-
The company is experiencing remarkable revenue growth, with a rate of 13.27%, outperforming the industry average of 12.31%.
Debt To Equity Ratio
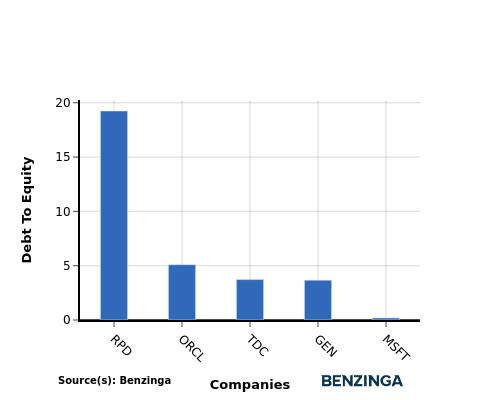
The debt-to-equity (D/E) ratio measures the financial leverage of a company by evaluating its debt relative to its equity.
Considering the debt-to-equity ratio in industry comparisons allows for a concise evaluation of a company's financial health and risk profile, aiding in informed decision-making.
In light of the Debt-to-Equity ratio, a comparison between Microsoft and its top 4 peers reveals the following information:
-
In terms of the debt-to-equity ratio, Microsoft has a lower level of debt compared to its top 4 peers, indicating a stronger financial position.
-
This implies that the company relies less on debt financing and has a more favorable balance between debt and equity with a lower debt-to-equity ratio of 0.19.
Key Takeaways
For Microsoft in the Software industry, the PE ratio is low compared to peers, indicating potential undervaluation. The PB ratio is also low, suggesting a possible bargain opportunity. However, the PS ratio is high, signaling rich valuation based on revenue. In terms of ROE, Microsoft shows lower profitability compared to peers. The high EBITDA and gross profit levels reflect strong operational performance. Additionally, the high revenue growth indicates a positive outlook for the company's future prospects.
This article was generated by Benzinga's automated content engine and reviewed by an editor.
Posted-In: BZI-IANews Markets Trading Ideas