Candlesticks - Is Lululemon Trade Over?
By TradersHuddle Staff, January 17
Shares of lululemon athletica (NASDAQ: LULU) ended the trading session lower by $1.28 or -2.07% from its previous close despite Jefferies bumping its target price on the stock to $65 from $54. lululemon's price action formed what is considered to be a bearish engulfing candlestick chart pattern.
Lululemon's current stock range is defined by calculated support defined at $46.51 and by the resistance level at $62.25, which should be used by traders planning their moves.
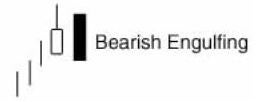
Traders wanting to establish a position in lululemon or traders that are already holding the stock need to pay close attention at the bearish engulfing pattern, since it could mark a trend reversal to current price action. The Bearish engulfing pattern is a leading warning sign for a trend reversal to occur.
Lululemon Athletica Inc. (NASDAQ: LULU) designs and retails athletic clothing. The Company produces fitness pants, shorts, tops and jackets for yoga, dance, running, and general fitness.
The bearish engulfing pattern is a leading indicator that provides an alert to traders that the current trend is about to reverse.
The preceding article is from one of our external contributors. It does not represent the opinion of Benzinga and has not been edited.
© 2025 Benzinga.com. Benzinga does not provide investment advice. All rights reserved.
Posted-In: candlestick lululemonMarkets Trading Ideas