Fluor Corp ( FLR:NYSE )
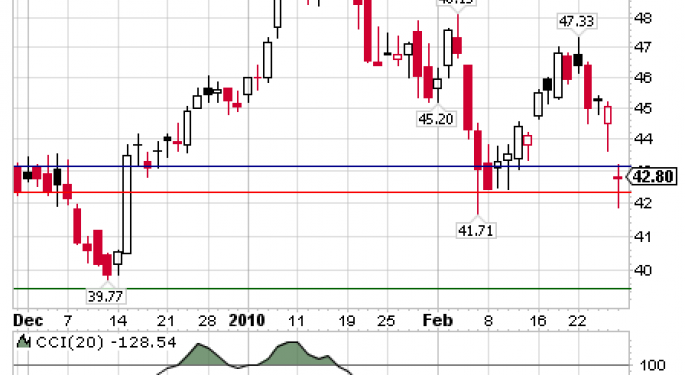
The shares of Fluor Corp ( FLR:NYSE ) gapped down on 2252010 after fourth-quarter profit fell short of analyst expectations, and the Company cut its guidance for 2010 stating that orders remain weak and they expect delays in large projects .
That news helped reinforce the direction of the share price but in reality the share price has been in a decline since January 14th when the stock reached a price of 50.50.
The technical indicators RSI (14), SSTO ( 14,3 ) and CCI (20 ) are not signaling that "bullish" conditions lie ahead for Fluor Corp ( FLR ) . In fact the CCI indicator is signaling a SELL the stock.
In the next session, if it is an "Upside Monday", the stock price may experience a rebound, giving a better entry level for a short position, but that will be short lived and the correction will continue. If my interpretation of the daily chart is correct, then I suggest that the stock has more to decline . Presently I have a downside target of 38.50 . The various derived Resistance and Support levels are shown below.
Fluor Corp ( FLR:NYSE )
Resistance and Support Levels
- R4- 46.67
- F- 46.40
- R3- 45.32
- F- 45.18
- R2- 43.97
- F- 43.86
- 43.64
- R1- 43.38
- 43.20
- DC- 42.80
- F- 42.30
- S1- 42.03
- F- 41.34
- S2- 41.27
- S3- 39.92
- S4-38.57
© 2025 Benzinga.com. Benzinga does not provide investment advice. All rights reserved.
Posted-In: analystsEarnings News Guidance Short Ideas Technicals Intraday Update Markets


