Options Corner: Sanofi's Post-Earnings Drama Delivers A Contrarian Discount

With investors concerned about overall economic stability amid the Trump administration's tariff impact, they're not in a particularly generous mood. That may be the lesson learned the hard way by global pharmaceutical giant Sanofi SA (NASDAQ:SNY). Despite delivering an earnings report that offered an encouraging view, it wasn't a perfect print. Subsequently, SNY stock dropped sharply, potentially presenting a bounce-back opportunity for intrepid contrarians.
For the second quarter, Sanofi reported adjusted earnings per share of 1.59 euros or 90 cents per American depositary receipt (ADR) shares. This figure missed analysts' consensus estimate of 96 cents. On the top line, the performance was better, with the drugmaker ringing up 9.99 billion euros or $11.33 billion. Unfortunately, this figure also narrowly missed the consensus estimate of $11.53 billion.
At first glance, a miss on both the top and bottom lines would ordinarily warrant volatility in the underlying security; hence, the red ink in SNY stock shouldn't be surprising. However, Sanofi brought to the table line items that warranted excitement.
In particular, the company's therapeutic Dupixent — a prescription medication used to treat certain inflammatory conditions like eczema and asthma — saw sales increase by 21.1% to 3.83 billion euros. As well, vaccine sales reached 1.21 billion euros, representing a 10.3% increase. Overall, per Sanofi CEO Paul Hudson, the company delivered 10.1% sales growth, thanks in large part to its nine newly launched medicines and vaccines seeing growth of 47.3%.
It’s also important to note that Sanofi CFO François Roger expressed confidence that the Trump tariffs will have little impact on the drugmaker in 2025. Much of this insulation is due to the company's inventory position in the U.S.
Unfortunately, these nuances did not convince investors to hold onto SNY stock, which dropped more than 8% during the afternoon hours.
Crimson-Stained SNY Stock Presents A Possible Discount For Contrarians
From a bird's-eye-view, SNY stock appears favorably priced. While Sanofi didn't meet headline numbers, that's also a snapshot in time. With encouraging results for its new therapeutics and vaccines, SNY would seem to have a reasonable case for upside. However, this perspective presupposes that the security was appropriately priced earlier and that it will eventually return to its rightful territory.
Frankly, we just don't know if that's objectively true or not. This perspective comes from our collective lived experience, that the market tends to overreact to both good and bad news. However, very few of us rarely stop to think about the broader implications. Share price and earnings are examples of continuous scalar signals. They're unbounded so they can theoretically rise indefinitely. By logical deduction, we cannot objectively determine what a "good price" is or what "bad earnings" means.
One of the very few discrete, objective truths that we can analyze in the equities sector is that, at the end of the day, the market is either a net buyer or a net seller.
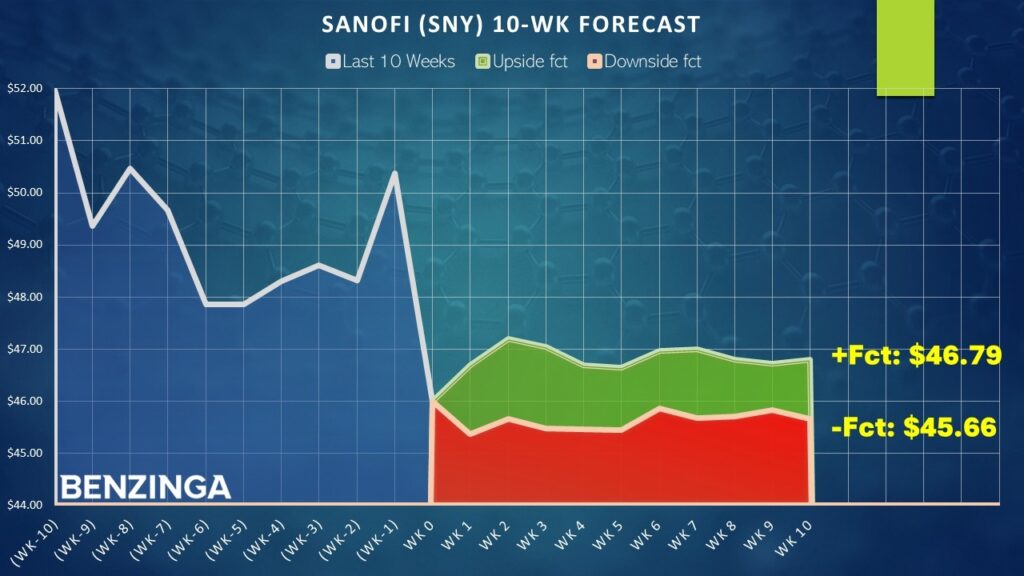
Looking back at the last 10 weeks, what we know objectively about SNY stock is that the market voted to buy the security four times and sell six times. Throughout this period, SNY incurred a downward trajectory. For brevity, we can label this sequence as 4-6-D.
Granted, it may look absurd to compress the price magnitude of SNY stock into a simple binary code. But what we have accomplished here is to establish a behavioral picture of the security. From here, we can look back at how the market has historically responded to the 4-6-D sequence. Additionally, we can look back at other 10-week rolling sequences in our dataset (which in this case starts from January 2019) to capture a holistic demand profile:
L10 Category
Sample Size
Up Probability
Baseline Probability
Median Return if Up
1-9-D
3
66.67%
53.64%
0.66%
2-8-D
7
42.86%
53.64%
2.73%
3-7-D
16
68.75%
53.64%
2.05%
3-7-U
3
0.00%
53.64%
N/A
4-6-D
37
62.16%
53.64%
1.49%
4-6-U
17
58.82%
53.64%
0.87%
5-5-D
63
57.14%
53.64%
1.77%
5-5-U
39
46.15%
53.64%
1.05%
6-4-D
18
61.11%
53.64%
1.55%
6-4-U
46
43.48%
53.64%
1.38%
7-3-D
5
40.00%
53.64%
2.98%
7-3-U
39
53.85%
53.64%
1.36%
8-2-U
25
52.00%
53.64%
2.04%
9-1-U
5
60.00%
53.64%
0.23%
From the table above, the chance that a long position in SNY stock will be profitable on any given week is 53.64%, a small upward bias. This is effectively our null hypothesis, the assumption of no mispricing. However, our alternative hypothesis is that, because of the flashing of the 4-6-D sequence, this probability of upside stands at 62.16%. Therefore, the deck is hot in our favor and an incentive exists to place a bet.
Assuming the positive pathway, the median expected return off the 4-6-D sequence is a 1.49% move. Should the bulls maintain control for a second week, the expected median performance is an additional 1.08%. If SNY stock manages to finish this week at around $46, it would theoretically be on course to reach approximately $47.20.
However, given the magnitude of volatility, it's possible that — should a bounce back materialize — the upside move may be stronger than usual.
Putting The Data To Work
For aggressive traders, the 45.00/47.50 bull call spread expiring Aug. 15 could be an enticing idea. This transaction involves buying the $45 call and simultaneously selling the $47.50 call, for a net debit paid of $100 (the most that can be lost in the trade). Should SNY stock rise through the short strike price ($47.50) at expiration, the maximum profit is $150, a payout of 150%.
Of course, for this trade to pan out, SNY stock would have to deliver an above-average performance within a short time period. For a more conservative trade, you may consider the same call spread — 45.00/47.50 — but for the Sep. 19 expiration date. However, this will reduce the max payout to around 108%.
Either way, much will hinge on the reliability of the 4-6-D sequence as a predictive signal. Running a one-tailed binomial test reveals a p-value of 0.1509, which means that there's a 15.09% chance that the implications of the signal could materialize randomly rather than intentionally. That's not going to meet the threshold of statistical significance. However, I would argue that the signal is empirically intriguing given the context of the market's open, entropic system.
Further, SNY stock has a history of marching higher from extreme volatility, such as the late October 2023 selloff. So, there's another chance for the bulls to place a daring wager.
The opinions and views expressed in this content are those of the individual author and do not necessarily reflect the views of Benzinga. Benzinga is not responsible for the accuracy or reliability of any information provided herein. This content is for informational purposes only and should not be misconstrued as investment advice or a recommendation to buy or sell any security. Readers are asked not to rely on the opinions or information herein, and encouraged to do their own due diligence before making investing decisions.
Read More:
Image: Shutterstock
© 2025 Benzinga.com. Benzinga does not provide investment advice. All rights reserved.
Posted-In: Expert Ideas Options Trade of the Day Stories That MatterEarnings Misses Equities Long Ideas Options Politics