Top 10 Financial ETFs
There are currently nearly 40 ETFs oriented to the financial sector. The following analysis features a reasonable list of ETF selections. We believe these constitute excellent index-based choices individuals and financial advisors may utilize.
ETFs are based on indexes tied to well-known index providers including Russell, S&P, Barclays, MSCI, Dow Jones and so forth. Also included are some so-called “enhanced” indexes that attempt to achieve better performance through more active management of the index.
The financial sector has been at the epicenter of economic and stock market woes during the 2008-2011 (and perhaps beyond) periods owing primarily to the housing bubble bust and collapse of security products created to accommodate rising real estate prices. As investors know, this collapse has led to ongoing bailouts, bankruptcies and outright government takeovers.
The sector was on the mend to start 2012 but as problems in the eurozone once again heated-up and the economy overall began to weaken the sector weakened once again. From mid-November to mid-February 2012 (a three month span) many featured ETFs have gained as much as a stunning 50%. Now all the old problems have come back to haunt the sector to wit, JPM’s stunning loss in May.
Markets overall were in rally mode to begin 2012 albeit on ultra-light volume but has now faltered sharply. One thing is historically true; there has never been a sustainable bull market without financials being with the trend or a leader. Investors need to pay attention to this going forward and monitor this relationship.
Another factor to note with charts posted is the similarities in trends and performance from one to another. This isn’t a coincidence given overall index constituent similarities. Further, easy money policies of the Fed during the period covered have made performance results hardly distinguishable one from another.
There are catchall sectors like XLF covering the entire sector and individual areas targeting banking, brokering and insurance for investors wishing to isolate their focus. So-called “enhanced” indexes can outperform on the upside but perhaps underperform as markets decline. We believe for these ETFs a more active trading approach is necessary.
We feature a technical view of conditions from monthly chart views which we believe adds value to the process. Simplistically, we recommend longer-term investors stay on the right side of the 12 month simple moving average. When prices are above the moving average, stay long, and when below remain in cash or short. Some more interested in a fundamental approach may not care so much about technical issues preferring instead to buy when prices are perceived as low and sell for other reasons when high; but, this is not our approach.
Premium members to the ETF Digest receive added signals when markets become extended such as DeMark triggers to exit overbought/oversold conditions.
For traders and investors wishing to hedge, leveraged and inverse issues are available to utilize from ProShares and Direxion and where available these are noted.
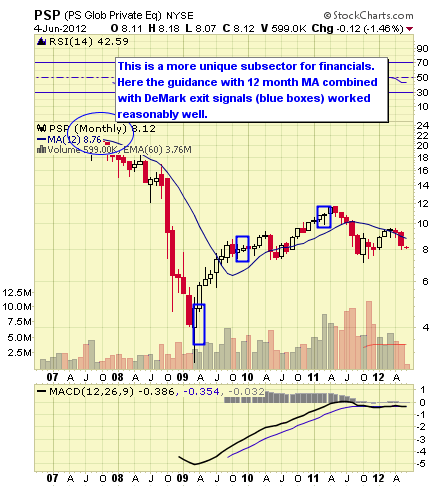
#10: PowerShares Global Listed Private Equity ETF (NYSE: PSP) 
PSP tracks the Global Listed Private Equity Index. This is a much more unique or niche area of the financial sector including global private banks, investment companies, venture capitalists, brokers and others. These consist of between 40-60 publicly listed companies whose principal business is to invest in and lend capital to privately held companies or what some would term “merchant banking”. The expense ratio is 0.60% which is higher than the group but is a more specialized ETF.
AUM exceeds $265M and average daily trading volume is roughly 218K shares. As of June 2012 the annual dividend was 7.61% and YTD return was 1.13%. The 1 YR return -26.20%.
PSP Top Ten Holdings & Weightings
Data as of May 2012
-
Ratos AB (RATO B): 4.79%
-
Onex (5987): 4.47%
-
Hal Trust (HAL): 4.22%
-
Leucadia National Corporation (LUK): 4.14%
-
3i Group (III): 3.91%
-
Ares Capital Corporation (ARCC): 3.75%
-
Partners Group Holding (PGHN): 3.71%
-
Eurazeo Common Stock (EUZOF): 3.44%
-
Wendel (MF): 3.35%
-
American Capital Ltd (ACAS): 3.23%
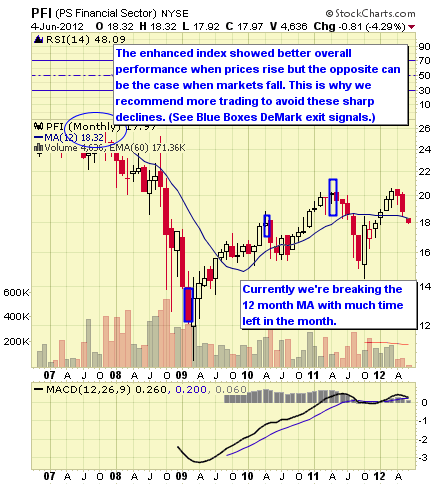
#9: PowerShares Financial ETF (NYSE: PFI) 
PFI follows the Dynamic Intellidex Index which is comprised of stocks of U.S. financial companies. The Index is designed to provide capital appreciation by thoroughly evaluating companies based on a variety of investment merit criteria, including fundamental growth, stock valuation, investment timeliness and risk factors. This is another “enhanced” index where the goal is to outperform more static indexes in all market conditions. The fund was launched October 2006. The expense ratio is 0.60%. AUM equal $16.9M and average daily trading volume is 4K shares. As of June 2012 the annual dividend yield was 1.09% and YTD return 1.21%. The 1 YR return was -5.41%.
(Note: AUM is less than $25M which generally is the threshold for a successful fund with good liquidity. AUM less than $25M is generally the threshold for a successful fund with good liquidity. Despite lower AUM and low trading volume the returns overall have been relatively better, merit close monitoring and your consideration.)
PFI Top Ten Holdings & Weightings
Data as of May 2012
-
Discover Financial Services (DFS): 2.67%
-
U.S. Bancorp (USB): 2.67%
-
American Express Co (AXP): 2.63%
-
Moody's Corporation (MCO): 2.62%
-
Invesco Ltd. (IVZ): 2.60%
-
T. Rowe Price Group (TROW): 2.59%
-
BB&T Corp (BBT): 2.58%
-
Principal Financial Group (PFG): 2.57%
-
Prudential Financial Inc (PRU): 2.51%
-
CNA Financial Corp (CNA): 2.48%
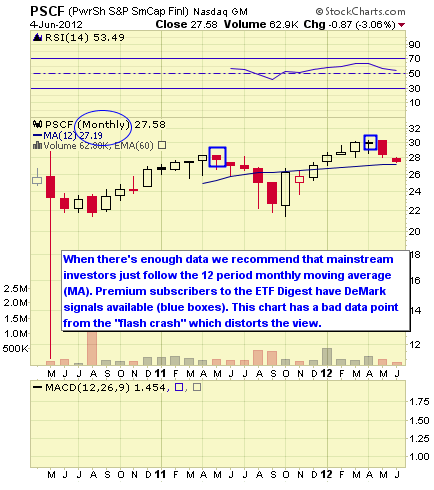
#8: PowerShares S&P Small Cap Financials (NYSE: PSCF)
PSCF follows the S&P 600 Small Cap 600 Index which is comprised of common stocks of U.S. financial service companies that are principally engaged in the business of providing services and products, including banking, investment services, insurance and real estate finance services. The fund was launched in April 2010. The expense ratio is 0.29%. AUM equal $74M and average daily trading volume is less than 9K shares. As of June 2012 the annual dividend was 1.93% and YTD return was 3.14%. The 1 YR return was 3.86%.
(Note: Small cap issues generally have higher beta but may offer some safe harbor away from mortgage related troubles afflicting the larger and well-known firms.)
PSCF Top Ten Holdings & Weightings
Data as of May 2012
-
Kilroy Realty Corporation (KRC): 3.08% -
BioMed Realty Trust Inc (BMR): 2.83%
-
Mid-America Apartment Communities (MAA): 2.65%
-
Extra Space Storage, Inc. (EXR): 2.64%
-
Tanger Factory Outlet Centers (SKT): 2.61%
-
Proassurance Corporation (PRA): 2.61%
-
Post Properties Inc (PPS): 2.41%
-
Delphi Financial Group (DFG): 2.39%
-
LaSalle Hotel Properties (LHO): 2.33%
-
Entertainment Properties Trust (EPR): 2.09%
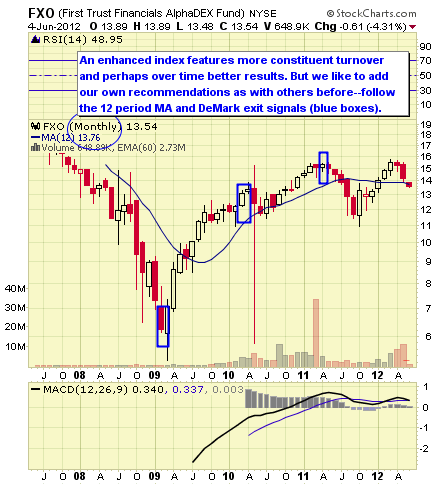
#7: First Trust Financials AlphaDex ETF (NYSE: FXO)
FXO follows the StrataQuant Financials Index which is an “enhanced” index developed, maintained and sponsored by the NYSE Euronext. It creates financial stocks for the index from the Russell 1000 index. The fund was launched in May 2007. The expense ratio is 0.70%. AUM is currently near $153M while average daily trading volume is near 398K shares. As of June 2012 the annual dividend was 2.34% and YTD return was 3.56%. The 1 YR return was -6.52%.
(Note: the key determinant with enhanced indexes is they “should” outperform on the upside and “may” underperform on the downside. This makes for more active position management from our view.)
FXO Top Ten Holdings & Weightings
Data as of May 2012
-
Janus Capital Group, Inc. (JNS): 1.34% -
Citigroup Inc (C): 1.32%
-
JPMorgan Chase & Co (JPM): 1.31%
-
Goldman Sachs Group Inc (GS): 1.31%
-
Lincoln National Corp (Radnor, PA) (LNC): 1.29%
-
Zions Bancorporation (ZION): 1.25%
-
Capital One Financial Corp (COF): 1.25%
-
Protective Life Corp (PL): 1.25%
-
Morgan Stanley (MS): 1.23%
-
Hartford Financial Services Group Inc (HIG): 1.23%
#6: SPDR S&P Regional Banking ETF (NYSE: KRE)
KRE follows the KBW Regional Banking Index. Launched in June 2006 the index uniquely consists of an equally weighted index of regional bank issues. (Note: it is thought some of these banks are more immune to global credit risk conditions which may only be partly the case.) The expense ratio is 0.35%. AUM equal $1.1B and average daily trading volume is a high 2.8M shares.
The high volume means more speculation within the sector given more options trading and the employment of long/short strategies. As of June 2012 the annual dividend was 1.35% and YTD return was 3.97%. The 1 YR return was 3.16%.
KRE Top Ten Holdings & Weightings
Data as of May 2012
-
Regions Financial Corporation (RF): 1.98%
-
Huntington Bancshares Inc (HBAN): 1.94%
-
Susquehanna Bancshares Inc (SUSQ): 1.91%
-
PNC Financial Services Group Inc (PNC): 1.90%
-
City National Corp (CYN): 1.90%
-
BancorpSouth Inc. (BXS): 1.87%
-
Umpqua Holdings Corporat
The preceding article is from one of our external contributors. It does not represent the opinion of Benzinga and has not been edited.
© 2025 Benzinga.com. Benzinga does not provide investment advice. All rights reserved.
Posted-In: ETFsLong Ideas Sector ETFs Short Ideas Specialty ETFs Markets Trading Ideas ETFs