Stocks Are Overbought At Levels Not Seen Since 2013

After a strong bullish run off of February lows, the S&P 500 finished off last week with its first three consecutive down days in over a month. According to Bespoke, the pullback could be a response to the market recently hitting its most overbought level since 2013.
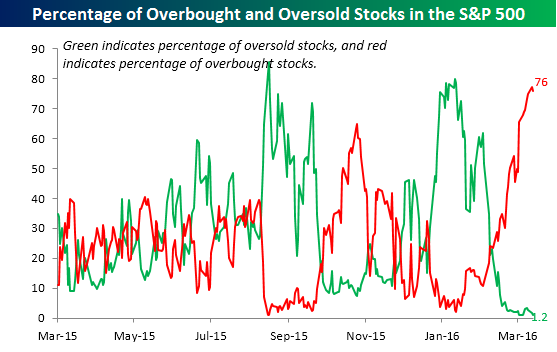
“Today’s weakness in equities is sure to put some downward pressure on the percentage of overbought stocks,” Bespoke wrote on March 23. “But in the wake of the big rally over the last six weeks, the net percentage of overbought (1+ standard deviation above 50-DMA) stocks in the S&P 500 surged above 75% earlier this week; the highest in over three years.”
Related Link: IEA: The Next Oil Price Shock Could Be To The Upside
The chart below shows that the previous peak in late October of last year only climbed as high as around 65 percent.
Another popular metric market technicians use to determine the overbought or oversold nature of a stock is the Relative Strength Index, or RSI. Stocks are typically considered overbought when their RSI hits 70 or higher. The SPDR S&P 500 ETF Trust (NYSE: SPY) reached the 70 RSI mark prior to the three-day pullback. The RSI has now dropped to 63.7.
Despite the three day decline, the S&P 500 demonstrated some resiliency in Thursday’s session, closing above its opening price and well off its intra-day low.
Disclosure: the author holds no position in the stocks mentioned.
© 2025 Benzinga.com. Benzinga does not provide investment advice. All rights reserved.
Posted-In: Bespoke relative strength index RSITechnicals Psychology Top Stories Trading Ideas General Best of Benzinga