What's Next: Honeywell Intl's Earnings Preview
Honeywell Intl (NASDAQ:HON) will release its quarterly earnings report on Thursday, 2025-07-24. Here's a brief overview for investors ahead of the announcement.
Analysts anticipate Honeywell Intl to report an earnings per share (EPS) of $2.64.
Anticipation surrounds Honeywell Intl's announcement, with investors hoping to hear about both surpassing estimates and receiving positive guidance for the next quarter.
New investors should understand that while earnings performance is important, market reactions are often driven by guidance.
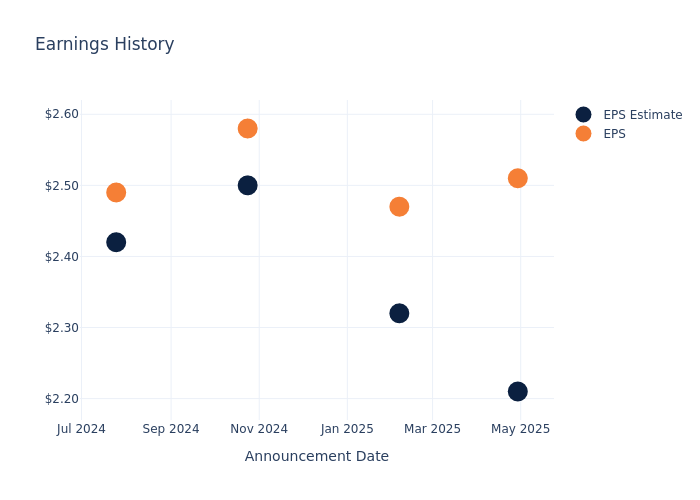
Earnings History Snapshot
During the last quarter, the company reported an EPS beat by $0.30, leading to a 0.47% drop in the share price on the subsequent day.
Here's a look at Honeywell Intl's past performance and the resulting price change:
| Quarter | Q1 2025 | Q4 2024 | Q3 2024 | Q2 2024 |
|---|---|---|---|---|
| EPS Estimate | 2.21 | 2.32 | 2.50 | 2.42 |
| EPS Actual | 2.51 | 2.47 | 2.58 | 2.49 |
| Price Change % | -0.0% | -2.0% | -1.0% | 0.0% |
Market Performance of Honeywell Intl's Stock
Shares of Honeywell Intl were trading at $236.58 as of July 22. Over the last 52-week period, shares are up 17.75%. Given that these returns are generally positive, long-term shareholders are likely bullish going into this earnings release.
Analyst Observations about Honeywell Intl
For investors, staying informed about market sentiments and expectations in the industry is paramount. This analysis provides an exploration of the latest insights on Honeywell Intl.
With 13 analyst ratings, Honeywell Intl has a consensus rating of Neutral. The average one-year price target is $237.62, indicating a potential 0.44% upside.
Comparing Ratings Among Industry Peers
In this analysis, we delve into the analyst ratings and average 1-year price targets of and 3M, three key industry players, offering insights into their relative performance expectations and market positioning.
- Analysts currently favor an Outperform trajectory for 3M, with an average 1-year price target of $167.8, suggesting a potential 29.07% downside.
Peer Metrics Summary
The peer analysis summary presents essential metrics for and 3M, unveiling their respective standings within the industry and providing valuable insights into their market positions and comparative performance.
| Company | Consensus | Revenue Growth | Gross Profit | Return on Equity |
|---|---|---|---|---|
| Honeywell Intl | Neutral | 7.87% | $3.79B | 8.03% |
| 3M | Outperform | 1.42% | $2.70B | 16.52% |
Key Takeaway:
Honeywell Intl ranks higher than its peers in Gross Profit and Return on Equity. It is in the middle for Revenue Growth.
About Honeywell Intl
Honeywell traces its roots to 1885 with Albert Butz's firm, Butz Thermo-Electric Regulator, which produced a predecessor to the modern thermostat. Other inventions by Honeywell include biodegradable detergent and autopilot. Today, Honeywell is a global multi-industry behemoth with one of the largest installed bases of equipment. It operates through four business segments: aerospace technologies (37% of 2023 company revenue), industrial automation (29%), energy and sustainability solutions (17%), and building automation (17%). Recently, Honeywell has made several portfolio changes to focus on fewer end markets and align with a set of secular growth trends. The firm is working diligently to expand its installed base, deriving around 30% of its revenue from recurring aftermarket services.
Understanding the Numbers: Honeywell Intl's Finances
Market Capitalization Highlights: Above the industry average, the company's market capitalization signifies a significant scale, indicating strong confidence and market prominence.
Revenue Growth: Honeywell Intl's remarkable performance in 3 months is evident. As of 31 March, 2025, the company achieved an impressive revenue growth rate of 7.87%. This signifies a substantial increase in the company's top-line earnings. In comparison to its industry peers, the company stands out with a growth rate higher than the average among peers in the Industrials sector.
Net Margin: Honeywell Intl's financial strength is reflected in its exceptional net margin, which exceeds industry averages. With a remarkable net margin of 14.75%, the company showcases strong profitability and effective cost management.
Return on Equity (ROE): Honeywell Intl's ROE stands out, surpassing industry averages. With an impressive ROE of 8.03%, the company demonstrates effective use of equity capital and strong financial performance.
Return on Assets (ROA): Honeywell Intl's ROA stands out, surpassing industry averages. With an impressive ROA of 1.93%, the company demonstrates effective utilization of assets and strong financial performance.
Debt Management: The company maintains a balanced debt approach with a debt-to-equity ratio below industry norms, standing at 1.88.
To track all earnings releases for Honeywell Intl visit their earnings calendar on our site.
This article was generated by Benzinga's automated content engine and reviewed by an editor.