Insights Ahead: O-I Glass's Quarterly Earnings
O-I Glass (NYSE:OI) is preparing to release its quarterly earnings on Tuesday, 2025-07-29. Here's a brief overview of what investors should keep in mind before the announcement.
Analysts expect O-I Glass to report an earnings per share (EPS) of $0.41.
Investors in O-I Glass are eagerly awaiting the company's announcement, hoping for news of surpassing estimates and positive guidance for the next quarter.
It's worth noting for new investors that stock prices can be heavily influenced by future projections rather than just past performance.
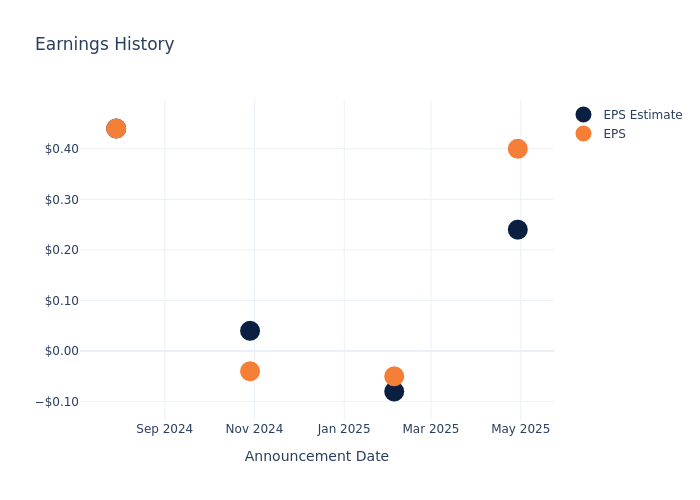
Historical Earnings Performance
Last quarter the company beat EPS by $0.16, which was followed by a 4.2% increase in the share price the next day.
Here's a look at O-I Glass's past performance and the resulting price change:
| Quarter | Q1 2025 | Q4 2024 | Q3 2024 | Q2 2024 |
|---|---|---|---|---|
| EPS Estimate | 0.24 | -0.08 | 0.04 | 0.44 |
| EPS Actual | 0.40 | -0.05 | -0.04 | 0.44 |
| Price Change % | 4.0% | 3.0% | -7.000000000000001% | 15.0% |
Market Performance of O-I Glass's Stock
Shares of O-I Glass were trading at $14.57 as of July 25. Over the last 52-week period, shares are up 23.84%. Given that these returns are generally positive, long-term shareholders are likely bullish going into this earnings release.
Analyst Insights on O-I Glass
Understanding market sentiments and expectations within the industry is crucial for investors. This analysis delves into the latest insights on O-I Glass.
Analysts have given O-I Glass a total of 8 ratings, with the consensus rating being Neutral. The average one-year price target is $16.5, indicating a potential 13.25% upside.
Comparing Ratings with Peers
The below comparison of the analyst ratings and average 1-year price targets of and O-I Glass, three prominent players in the industry, gives insights for their relative performance expectations and market positioning.
Summary of Peers Analysis
In the peer analysis summary, key metrics for and O-I Glass are highlighted, providing an understanding of their respective standings within the industry and offering insights into their market positions and comparative performance.
| Company | Consensus | Revenue Growth | Gross Profit | Return on Equity |
|---|---|---|---|---|
| O-I Glass | Neutral | -1.63% | $280M | -1.46% |
Key Takeaway:
O-I Glass is positioned in the middle among its peers based on consensus rating. It ranks at the bottom for revenue growth, indicating a decline in revenue. The company also lags in gross profit compared to its peers. Additionally, O-I Glass has a lower return on equity, reflecting lower profitability relative to its industry counterparts.
Get to Know O-I Glass Better
O-I Glass is the world's largest manufacturer of glass bottles; 70% of its revenue comes from outside the United States. O-I has a leading position in key markets such as Europe, North America, and Brazil. Beer is the primary end market for O-I's glass bottles, which are also used for wine, soda, spirits, condiments, and food. O-I is looking to maintain or expand its dominant positions in Europe, North America, and South America.
O-I Glass: Financial Performance Dissected
Market Capitalization Analysis: Positioned below industry benchmarks, the company's market capitalization faces constraints in size. This could be influenced by factors such as growth expectations or operational capacity.
Negative Revenue Trend: Examining O-I Glass's financials over 3 months reveals challenges. As of 31 March, 2025, the company experienced a decline of approximately -1.63% in revenue growth, reflecting a decrease in top-line earnings. In comparison to its industry peers, the company trails behind with a growth rate lower than the average among peers in the Materials sector.
Net Margin: O-I Glass's net margin falls below industry averages, indicating challenges in achieving strong profitability. With a net margin of -1.02%, the company may face hurdles in effective cost management.
Return on Equity (ROE): O-I Glass's ROE is below industry standards, pointing towards difficulties in efficiently utilizing equity capital. With an ROE of -1.46%, the company may encounter challenges in delivering satisfactory returns for shareholders.
Return on Assets (ROA): O-I Glass's ROA lags behind industry averages, suggesting challenges in maximizing returns from its assets. With an ROA of -0.18%, the company may face hurdles in achieving optimal financial performance.
Debt Management: With a high debt-to-equity ratio of 4.5, O-I Glass faces challenges in effectively managing its debt levels, indicating potential financial strain.
To track all earnings releases for O-I Glass visit their earnings calendar on our site.
This article was generated by Benzinga's automated content engine and reviewed by an editor.