Technical Analysis: Gold's Potential Move Depends on Mid-Term Channel
The Beginning
Everyone has seen the strong bull-trend in gold over the years. In the last five years, the commodity is up over 170%. This compares to a 11% loss in the S&P 500.
In the beginning, the main theme behind the bull-trend was a worry about inflation as world banks pumped money in the system to prop-up failing corporations, during the 2007 global financial crisis.
There is a crisis of confidence around the world, and when there is a crisis of confidence, people freak out. When people freak out, volatility reigns. When you get a crisis of confidence, money piles into “safe-havens”. These “safe-havens” usually include precious metals, particularly, gold.
With S&P downgrading the U.S. debt, it sapped confidence across the world, and markets across the world fell sharply. Besides this, we have a weakening economy, Congress has shown no inclination to act and provide fiscal stimulus, and there are still worries about Europe and Greece in particular.
Since August rumors circulated that the Chicago Mercantile Exchange would raise margins on metals. This caused commodities to act very volatile. The CME announced the rate increase on September 23rd and was effective on September 26th.
Also around this time, rumors also circulated saying that major hedge funds and central banks around the world with heavy precious metal exposure were liquidating their positions; again causing gold to fluctuate wildly.
Recent Analysis
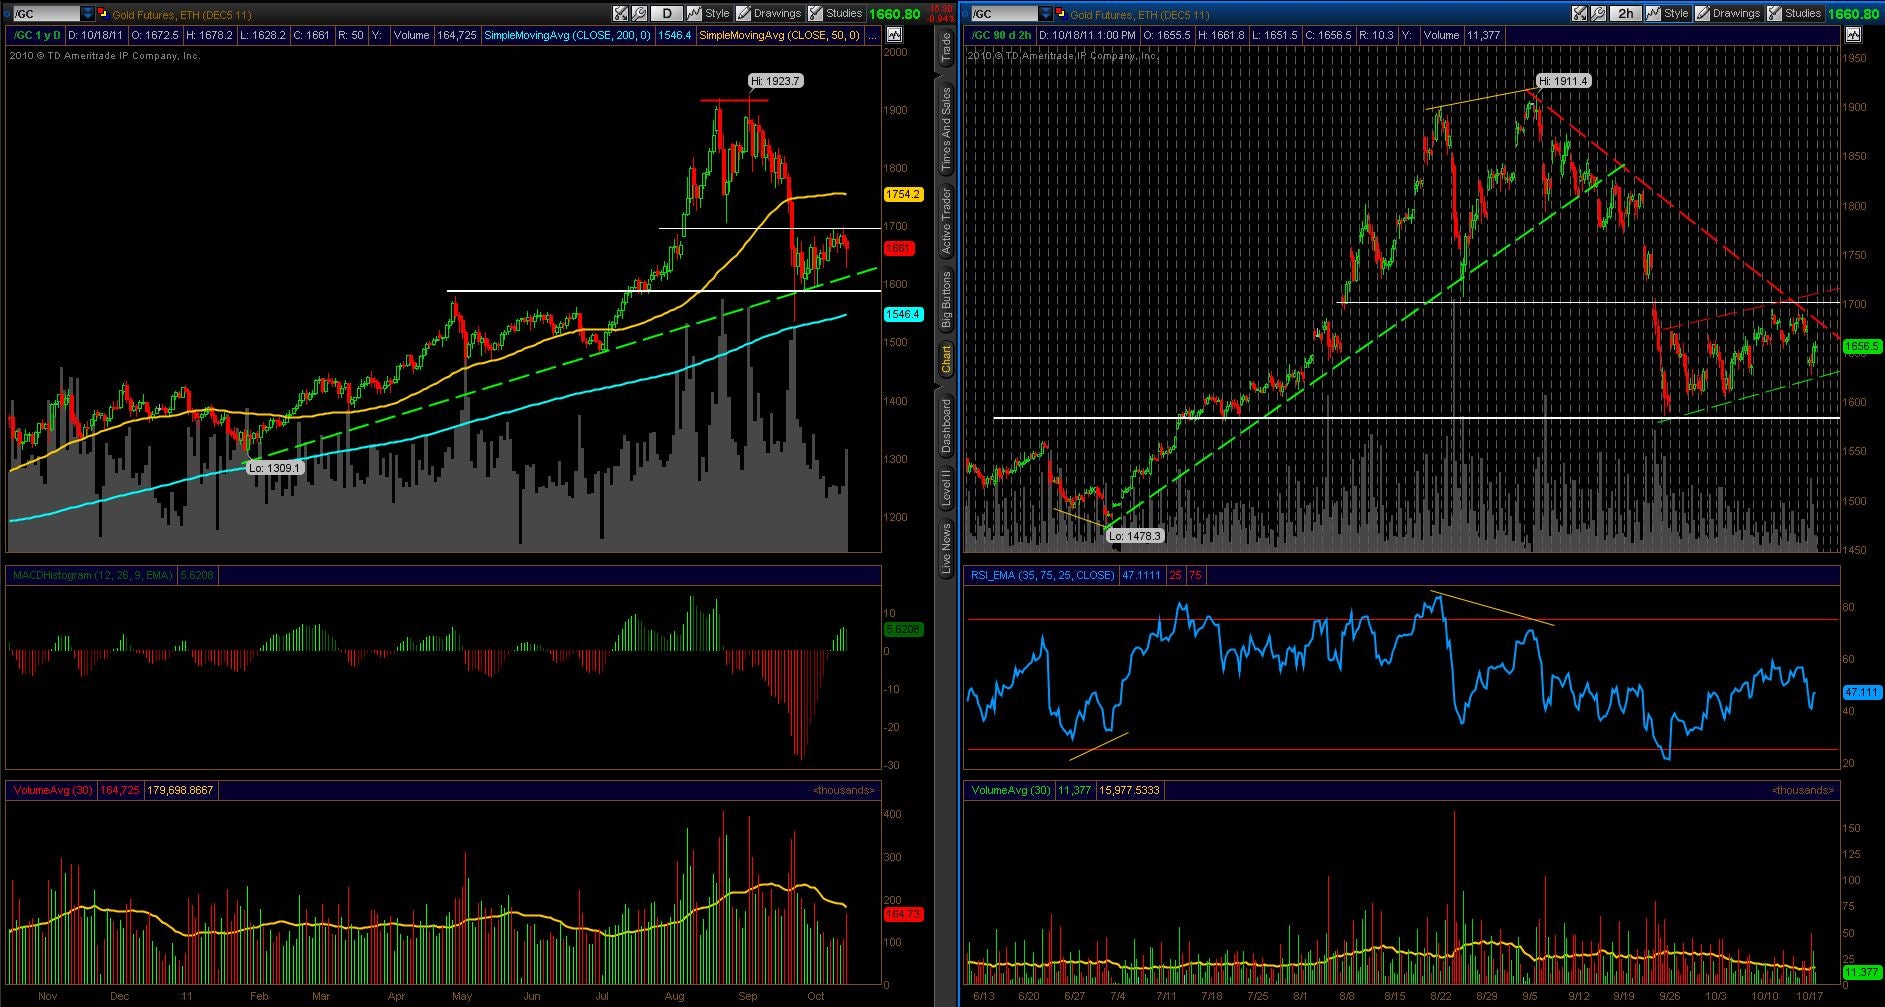
Gold futures made a Double-Top pattern from the end of August to the beginning of September just as the rumors circulated of margin hikes and hedge fund liquidations. This also was the all-time high in gold, at $1923.70 per ounce.
As the precious metal was topping out back in early September, the Relative Strength Index confirmed the weakness. RSI trended lower as gold futures were making new highs – this obvious divergence raised red flags.
Soon after the divergence in the RSI trend and the Double-Top pattern, the commodity crossed below a mid-term uptrend support line. A couple weeks after the broken support line, gold futures plummeted over 11% from approximately $1800 to about $1580.
Within the last few weeks, the precious metal has been trading between a horizontal channel from about $1580 as support and $1700 as resistance.
- Formed Double-Top from late August/early September
- Notable divergence in RSI to confirm Double-Top pattern
- Broke below mid-term uptrend support line in mid-September
Future Analysis
Gold will likely trade within this mid-term horizontal channel for the next couple months as global-macro events continue to unfold. We just saw today that the Produce Price Index in the United States has risen higher than expected. This could lead to higher prices in the future, causing inflation to rise and gold to follow as a hedge against it.
Currently in the short-term, gold is trading between a rising channel on light volume; however, still below the mid-term downtrend resistance line. The commodity is also still trading above its long-term uptrend support line, dating back to early 2011.
- Currently between short-term rising channel, could be precursor to next trend
- Will likely trade between mid-term horizontal channel for next couple months
- Still below mid-term downtrend resistance line
- Still above long-term uptrend support line
If gold breaks below its short-term rising channel, the likely move would be down to test the horizontal channel's support level at approximately $1580. If this is the case, a bounce of the $1580 level would be likely and continue to move higher and eventually test the mid-term downtrend resistance line.
If gold breaks above the mid-term downtrend resistance line, it will likely test and bounce lower off the top-end of the horizontal channel at around $1700.
Be aware that the trend is still up and above the 200-day moving average. These are still bullish signs as the long-term bullish trend is still intact. Also, any global-macro factor could change any of these scenarios.
Short/Mid-Term Support Levels
- ~$1630 (uptrend support line of short-term rising channel)
- ~$1580 (support level of mid-term horizontal channel)
- ~$1546 (200-day moving average)
Short/Mid-Term Resistance Levels
- ~$1675 (mid-term downtrend resistance line)
- ~$1700 (resistance level of mid-term horizontal channel)
- ~$1750 (recent price-gap level)

© 2025 Benzinga.com. Benzinga does not provide investment advice. All rights reserved.
Posted-In: Long Ideas News Short Ideas Futures Technicals Commodities Global Economics Best of Benzinga