4 Charts That Show Twitter's Growth Is Huge, But That's Not The Risk

The graphs below were produced by Capital Market Labs.
There has been a good deal of confusion surrounding Twitter Inc (NYSE: TWTR).
Here are the facts: Twitter has massive growth. It is also spending more on R&D than any firm in the Internet Software & Services Industry by so much that one needs a different chart for the firm and its peers.
In a way, Twitter can be thought of as a pure play R&D bet.
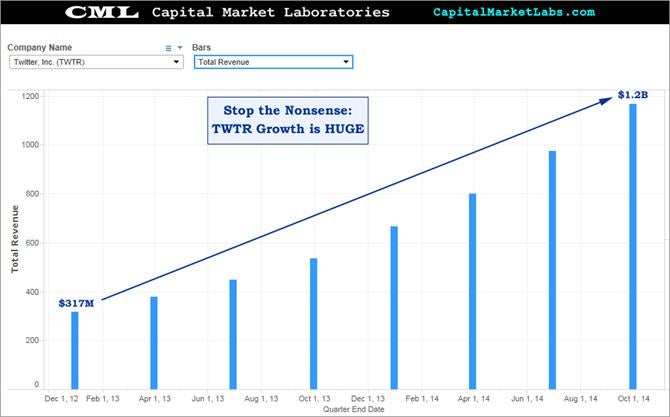
Revenue (TTM)
Twitter growth is huge, with a quadrupling in revenue the last three years.
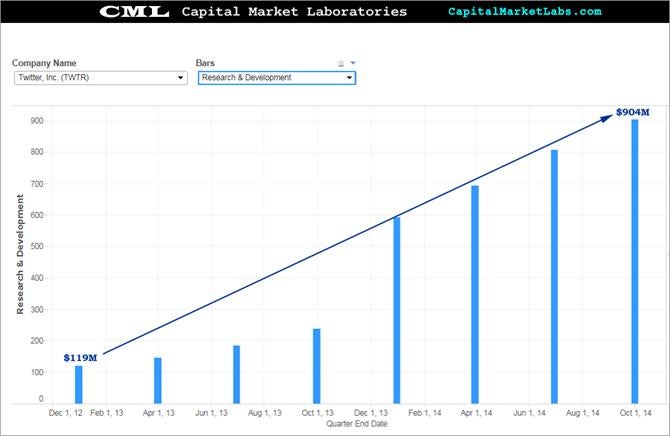
Research & Development (TTM)
Twitter's expenditures have increased eight-fold in three years.
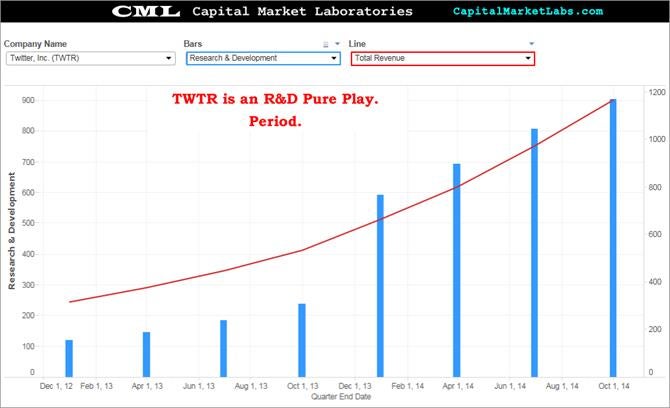
Revenue (TTM) Vs. R&D (TTM)
Let's combine the last two charts into one -- revenue and R&D have exponential trajectories.
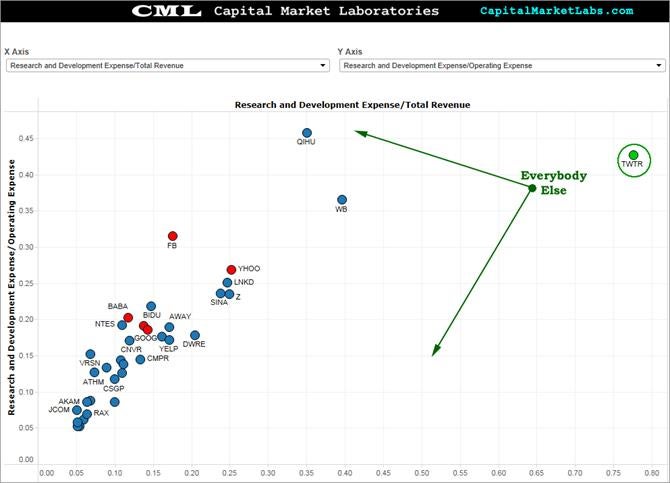
R&D Vs. Peers
Again, Twitter is the only pure play R&D bet in the Internet Software & Services industry. If one plots R&D spent per dollar of revenue on the x-axis and R&D spent per dollar of operating expense on the y-axis, there's Twitter...and then there's everybody else.
Ophir Gottlieb can be found on Twitter @ophirgottlieb.
This article was submitted by an external contributor and may not represent the views and opinions of Benzinga.
Posted-In: twitter stockTechnicals Tech Trading Ideas Best of Benzinga