Paramount Group Earnings Preview
Paramount Group (NYSE:PGRE) is set to give its latest quarterly earnings report on Wednesday, 2025-07-30. Here's what investors need to know before the announcement.
Analysts estimate that Paramount Group will report an earnings per share (EPS) of $0.14.
Anticipation surrounds Paramount Group's announcement, with investors hoping to hear about both surpassing estimates and receiving positive guidance for the next quarter.
New investors should understand that while earnings performance is important, market reactions are often driven by guidance.
Earnings Track Record
In the previous earnings release, the company beat EPS by $0.01, leading to a 7.23% increase in the share price the following trading session.
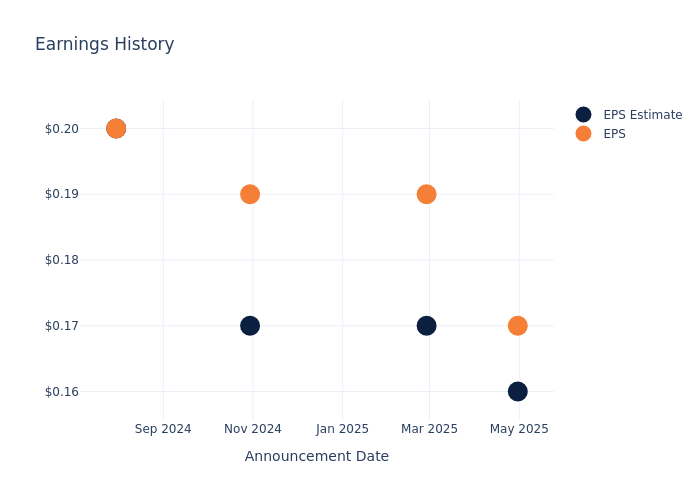
Here's a look at Paramount Group's past performance and the resulting price change:
| Quarter | Q1 2025 | Q4 2024 | Q3 2024 | Q2 2024 |
|---|---|---|---|---|
| EPS Estimate | 0.16 | 0.17 | 0.17 | 0.2 |
| EPS Actual | 0.17 | 0.19 | 0.19 | 0.2 |
| Price Change % | 7.000000000000001% | -2.0% | -4.0% | -3.0% |
Market Performance of Paramount Group's Stock
Shares of Paramount Group were trading at $6.23 as of July 28. Over the last 52-week period, shares are up 18.17%. Given that these returns are generally positive, long-term shareholders are likely bullish going into this earnings release.
Analysts' Take on Paramount Group
For investors, staying informed about market sentiments and expectations in the industry is paramount. This analysis provides an exploration of the latest insights on Paramount Group.
Analysts have given Paramount Group a total of 3 ratings, with the consensus rating being Outperform. The average one-year price target is $6.17, indicating a potential 0.96% downside.
Comparing Ratings with Peers
This comparison focuses on the analyst ratings and average 1-year price targets of Empire State Realty Trust, JBG SMITH Properties and Easterly Government Props, three major players in the industry, shedding light on their relative performance expectations and market positioning.
- Analysts currently favor an Underperform trajectory for Empire State Realty Trust, with an average 1-year price target of $8.3, suggesting a potential 33.23% upside.
- Analysts currently favor an Underperform trajectory for JBG SMITH Properties, with an average 1-year price target of $17.0, suggesting a potential 172.87% upside.
- Analysts currently favor an Neutral trajectory for Easterly Government Props, with an average 1-year price target of $23.5, suggesting a potential 277.21% upside.
Peer Metrics Summary
The peer analysis summary outlines pivotal metrics for Empire State Realty Trust, JBG SMITH Properties and Easterly Government Props, demonstrating their respective standings within the industry and offering valuable insights into their market positions and comparative performance.
| Company | Consensus | Revenue Growth | Gross Profit | Return on Equity |
|---|---|---|---|---|
| Paramount Group | Outperform | -0.98% | $108.97M | -0.32% |
| Empire State Realty Trust | Underperform | 6.21% | $91.51M | 0.46% |
| JBG SMITH Properties | Underperform | -16.87% | $59.01M | -2.71% |
| Easterly Government Props | Neutral | 8.07% | $52.92M | 0.22% |
Key Takeaway:
Paramount Group ranks at the bottom for Revenue Growth and Gross Profit among its peers. It is also at the bottom for Return on Equity.
About Paramount Group
Paramount Group Inc is a real estate investment trust engaged in owning, operating, managing, acquiring, and redeveloping high-quality, Class A office properties in select central business district (CBD) submarkets of New York City and San Francisco. The company operates in two geographical segments New York and San Francisco. The company derives nearly all of its majority of revenue from rental income.
Financial Insights: Paramount Group
Market Capitalization Analysis: Positioned below industry benchmarks, the company's market capitalization faces constraints in size. This could be influenced by factors such as growth expectations or operational capacity.
Revenue Challenges: Paramount Group's revenue growth over 3 months faced difficulties. As of 31 March, 2025, the company experienced a decline of approximately -0.98%. This indicates a decrease in top-line earnings. As compared to competitors, the company surpassed expectations with a growth rate higher than the average among peers in the Real Estate sector.
Net Margin: Paramount Group's net margin is impressive, surpassing industry averages. With a net margin of -5.36%, the company demonstrates strong profitability and effective cost management.
Return on Equity (ROE): Paramount Group's ROE surpasses industry standards, highlighting the company's exceptional financial performance. With an impressive -0.32% ROE, the company effectively utilizes shareholder equity capital.
Return on Assets (ROA): Paramount Group's ROA surpasses industry standards, highlighting the company's exceptional financial performance. With an impressive -0.13% ROA, the company effectively utilizes its assets for optimal returns.
Debt Management: Paramount Group's debt-to-equity ratio is below the industry average. With a ratio of 1.19, the company relies less on debt financing, maintaining a healthier balance between debt and equity, which can be viewed positively by investors.
To track all earnings releases for Paramount Group visit their earnings calendar on our site.
This article was generated by Benzinga's automated content engine and reviewed by an editor.