-
Target Area Reached - Market Turning Points
Wednesday, February 22, 2012 - 3:33pm | 2518Read More...Precision timing for all time frames through a multi-dimensional approach to technical cycles - Breadth - P&F and Fibonacci price projections and occasional Elliott Wave analysis “By the Law of Periodical Repetition, everything which has happened once must happen again, and again, and again...
-
The SPX 500 - Sleibhins Opinion
Sunday, June 26, 2011 - 9:21pm | 470Read More...In the attached chart [ SPX 500 Monthly ] we can see that the Price action, since March 2009, has been confined to an ascending channel. At this time the upper boundary is at 1515± and the lower boundary is at 1250 ±. It is believed that the Index is headed for 1250 ± . The chart...
-
DBB - A Candidate Once Again
Monday, March 1, 2010 - 3:41pm | 172Read More...Time to look, once more, at the shares of PS DB MultiSect Met ( DBB:NYSE ) or PowerShares Base Metals Fund ( DBB:NYSE ) as a potential short candidate. Previously it was a short candidate at 21.10 and the price objective was 19.71 . The share price reached a low of 21.02 where it reversed when...
-
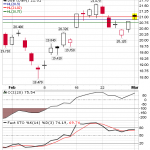
S&P 500 Large Cap Index ( SPX ) and S&P 500 SPDRs ( SPY ) _ The Last Gasp ?
Monday, March 1, 2010 - 5:19am | 291Read More...The S&P 500 Large Cap Index ( $SPX ) and the ETF S&P 500 SPDRs ( SPY ) continued their quest to arrive at the TOP. The $SPX Index gained 1.55 points to close at 1104.49 and the ETF SPY gained 0.07 points to close at 110.74 The technical indicators, as well as other analytical methods all...
-
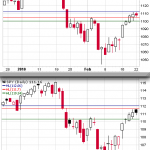
S&P 500 Index ( SPX ) and S&P SPDRs ( SPY ) Finish the Correction
Tuesday, February 23, 2010 - 9:18am | 260Read More...The main action in the S&P 500 Index ( $SPX ) was essentially completed in the first hour of trading. After the Open at 1100.00 the Index rose to a lower high of 1112.29. In the process the Fibonacci level 1112.24 was tested and resulted in a failure.as the Index dropped below that level and...
-

The MS Operation was Terminated
Sunday, February 21, 2010 - 10:09pm | 168Read More...Morgan Stanley ( MS:NYSE ) was a leader in the minor correction that took place in the S&P 500 Index ( $SPX:NYSE ) in the last session. The stock price continued to correct until it reached 26.92 where it along with the Index reversed and continued rising to find a Resistance level. On seeing...
-
S&P 500 Index ($SPX) & S&P 500 SPDRs (SPY)
Thursday, February 11, 2010 - 9:47am | 249Read More...Throughout the night session the price of the S&P 500 E-mini ( ESHO:CME) has been oscillating like a seismograph chart . At the present time the Futures are indicating a positive open. The S&P 500 Index ($SPX:NYSE) and the ETF S&P 500 SPDRs (SPY:NYSE) have formed long legged Dojis in...
-
S&P 500 SPDR ETF (SPY) Breaks Major Support Line
Wednesday, January 20, 2010 - 1:08pm | 191Read More...The S&P 500 SPDR ETF (NYSE: SPY), though not yet even close to falling out of its recent bullish trading range, may have just done something far more alarming. The support line that extends back to July (and arguably to March’s bottom) failed to act as a floor today. The ETF is under it for the...
-

Way of the SPX 500 - 110909
Saturday, September 12, 2009 - 10:09am | 158Read More...The session started with a slight drop of 0.22 points and then proceeded to test the Resistance at 1048.8 . The rise was stopped at 1048.18 and finished the day at 1042.73 . Looking at the Lower Chart one can see that the price action of the Index has been confined to a narrow Ascending Channel...
-
Way of the SPX 500 - 10092009
Thursday, September 10, 2009 - 4:45pm | 120Read More...At approximately 15:14 the Index broke above 1039.5 and didn't look back . There was a steady increase in price until the Index closed on the High at 1044.14 above former resistance and now support level at 1043.1 . This now sets the stage for a test at [ 1047.2 - 1048.8 ] and then [ 1055.3 -...
-

Way of the SPX - 08092009
Tuesday, September 8, 2009 - 5:58pm | 111Read More...Since the "spinning top morning star" the Index has now regained 33.42 points closing today at 1025.39 with a slight increase in volume. Prior to the holiday there had been decreasing volumes . In the next session, if there is upside the levels of resistance will be 1026 - 1034 and 1039. . My...
-
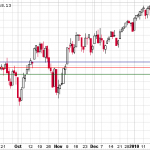
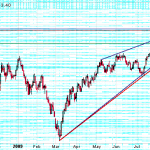
Where Goes the SPX 500 ?
Monday, September 7, 2009 - 6:56pm | 301Read More...There are a multitude views on the subject . Depending on your time frame , the Index will either go Up or Down. In the short term there is , in my opinion, still some upside before we get a modest correction. Chart One : Daily SPX 500 This shows that since early July the price action of the...
